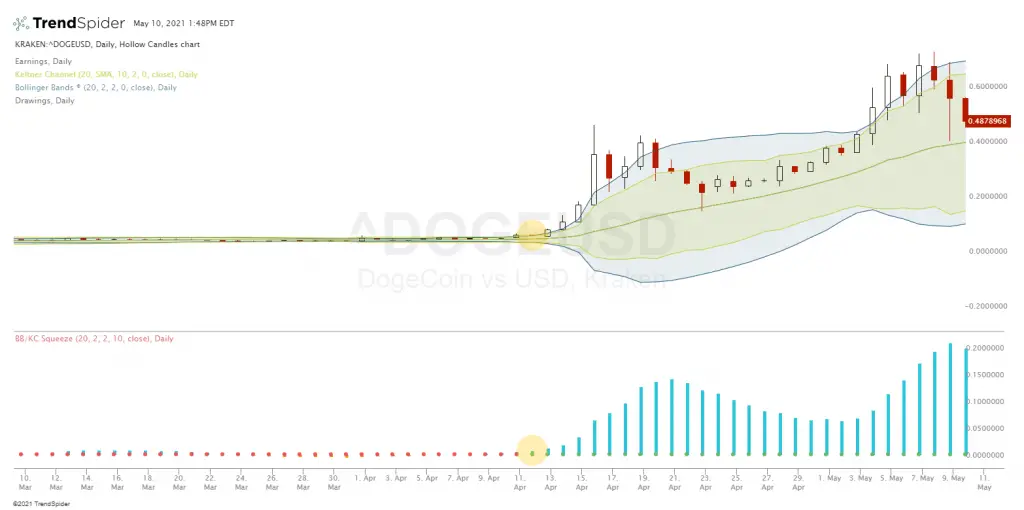
The BB/KC Squeeze Indicator, more popularly known as the TTM Squeeze Indicator is both a volatility and momentum indicator that visual shows the correlation between Bollinger Bands® and Keltner Channels on a chart. This helps to identify when a chart is compressing or ‘squeezing’ into a tight range as this signals when the probability becomes higher that prices could break out of a tight range and begin to trend or see a large trading range price expansion.
By helping to identify when the potential for time periods of volatility are about to begin, the TTM Squeeze can be a good technical tool for trading price action as it transitions from a slow low volatility range to a fast high volatility trend.
The momentum oscillator is the vertical histogram which indicates the direction momentum is moving in on the chart. The blue vertical lines are positive momentum and the orange vertical lines are negative momentum; in relation to where they are above or below the horizontal zero line.

The zero line is the horizontal line is where the squeeze is visualized by green and red dots. Green dots are a condition of no squeeze and the red dots show up to signal when the price action is squeezing.
The red dots signal a squeeze when the Bollinger Bands® are squeezed into Keltner Channels, you can see this on the chart below. When the Bollinger Bands expand outside the Keltner Channels the dot turns green in the histogram signaling the beginning of the volatility expansion.

Expanding momentum is shown by the bars growing on the TTM momentum histogram and the expansion of the Bollinger Bands®; with an end of the price squeeze being signaled by a change from red dots back to green. The TTM Squeeze Indicator helps quantify current chart momentum with a representation of the relationship between Bollinger Bands® and Keltner Channels showing compression and expansion.