This is a sample chapter from my book The Ultimate Guide to Chart Patterns.
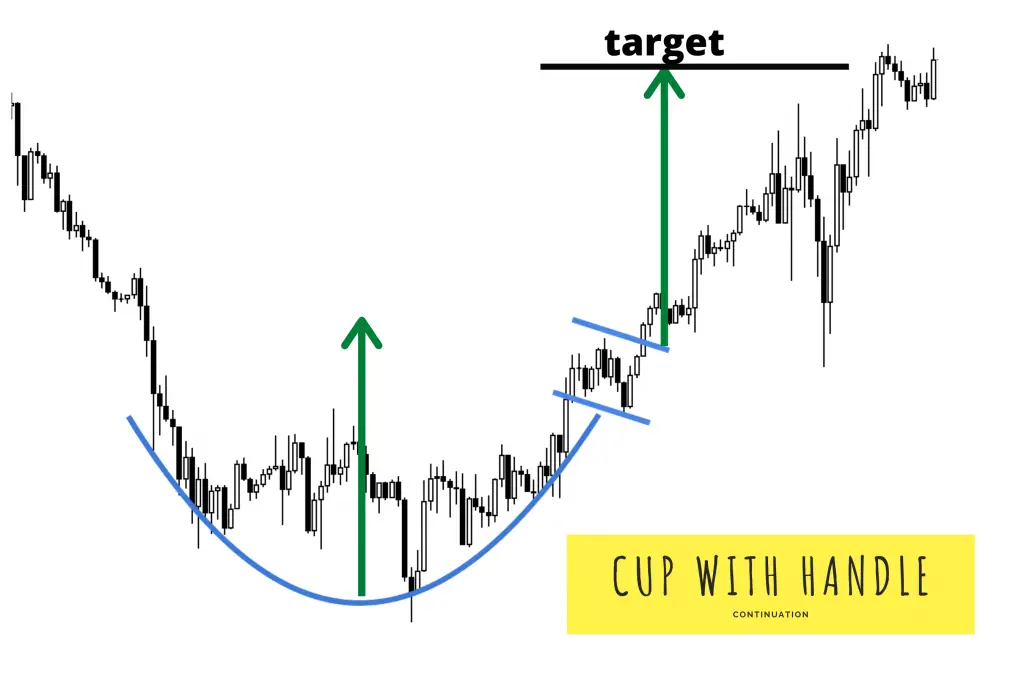
The cup and handle pattern is a bullish continuation pattern and momentum buy signal as it breaks out of the ‘handle’ in the formation. It was originally intended to be used with high growth stocks within the ‘CAN SLIM’ system.
I cup and handle chart pattern ideally takes place early in bull markets when the stock indexes are trading over their 200-day simple moving averages.
This is one of the newer chart formations. This chart pattern was first popularized by William J. O’Neil in the first edition of his 1988 book, ‘How to Make Money in Stocks’. In order for the cup and handle setup to have the highest odds of succeeding, ideally it should come after a clear uptrend was in place. However, the cup with handle is still valid after a downtrend or sideways market. The chart pattern consists of two key components: (1) cup and (2) handle.
The cup part of the formation is created when profit taking sets in or the market itself is in a correction and the stock sells off and forms the left side of the cup to the downside. The cup bottom is formed when the stock finally runs out of sellers at new low prices and buyers start moving in and bidding the stock back up again as sellers demand higher prices to sell the stock.
Most of the time as the stock emerges out of the right side of the cup in an uptrend it fails and meets resistance the first time it tries to break out to new high prices from previous highs inside the cup pattern. This is when the pattern forms a handle inside a trading range. The second run at new highs usually works as the majority of sellers have been worked through and the stock breaks out to new highs.
This pattern sets the stage for very nice up trends because the majority of short term traders sold as the stock fell into the cup, the bottom was formed when the holders of the stock refused to sell for less than the support level in the base of the cup, then profit takers were worked through as the stock came up through the right side of the cup.
The first-time buyers at new highs near the resistance price level above the cup will be the new selling pressure as the second break out of the pattern is attempted.
The breakout propels the stock upwards as seats on the bull bus get more expensive because no one wants to give up their long positions because the majority are profitable.
Cup and handle pattern chart facts:
- Cup and handle patterns are not good probability trades if the general market is in a correction or a bear market.
- The pattern has better odds if it is a stock in a strong sector that has increasing earnings growth expectations.
- The pattern has better odds of success if the stock had a previous uptrend leading into this pattern showing historical demand and accumulation.
- Check the depth and length of the cup. A cup-with-handle base usually corrects 20% to 30% from the base’s left-side high. Most are three to six months long, but can be as little as seven weeks or as long as a year or more. (William J. O’Neil parameters).
- Look for a classic shape. If you have to argue your way into believing the shape is a cup, it’s not a cup.
- Note how much of the cup is in the lower half. A steady climb up the right side is best.
- Look for a ‘U’ shape and volume that dries up near the cup’s low. Volume that dries up at the bottom suggests funds lost interest in selling. U-shaped bases are more likely to work than V-shaped.
- Cup and handle patterns can happen on both daily and weekly charts.
- This pattern has a higher probability of success if the breakout of the handle high happens on higher volume than the 10-day average volume of trading.
- This pattern is trying to capture a stock as it breaks out of its handle and starts an uptrend due to accumulation from money managers.
- The buy point is a momentum signal as the stock makes a new high inside the cup. The stop loss can be set between 7%-10% of the entry price. Proper position size could be 10% – 15% of trading capital.
- A price target could be between 20%-30% but they can go higher and of course they can also fall back in price and fail which is why a stop loss is always important.

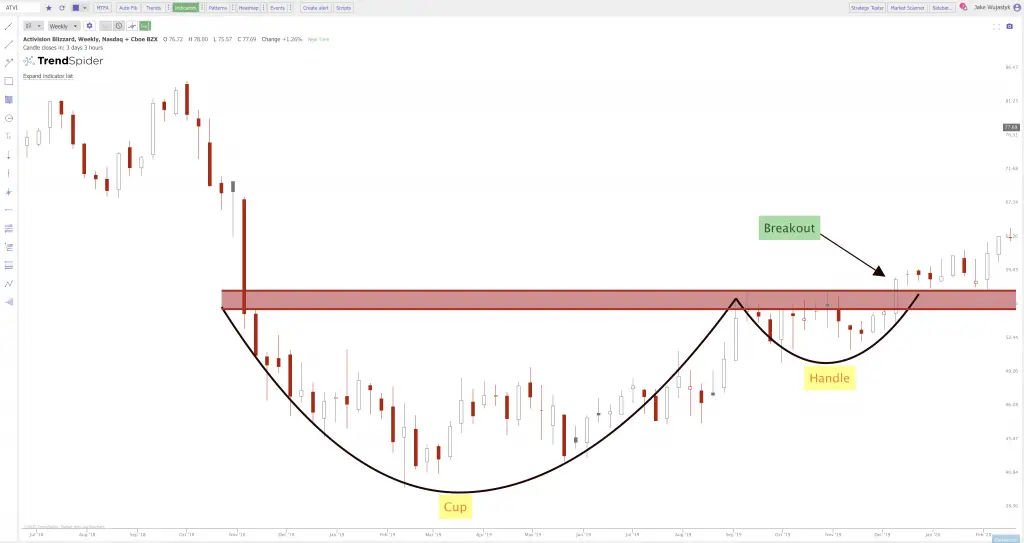
Activision Blizzard formed a cup on its weekly chart from November until August of 2019 and then a handle from September to December of 2019 before eventually breaking out.

Chart courtesy of TrendSpider.com
You can check out all the most popular chart patterns with my book The Ultimate Guide to Chart Patterns.