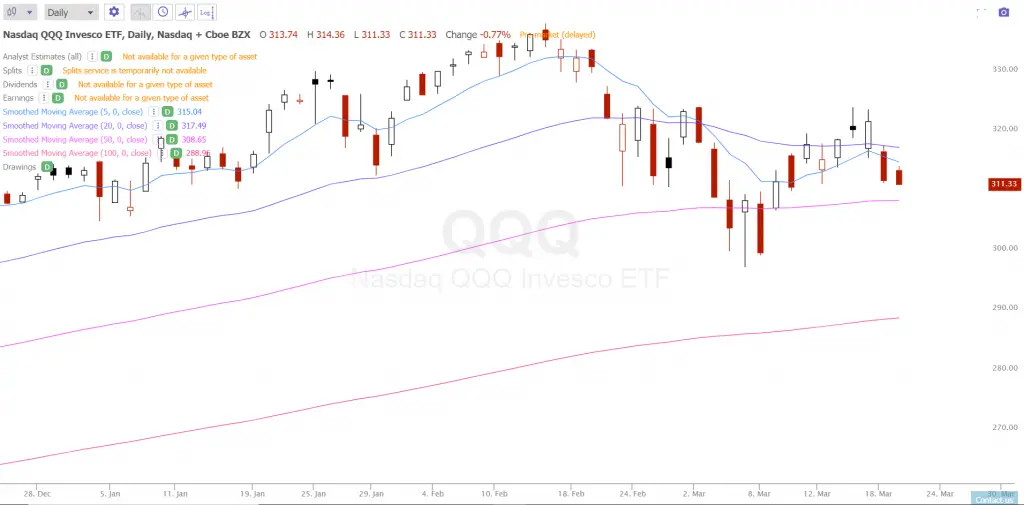
A smoothed moving average (SMMA) is like a simple moving average (SMA) as it tries to quantify the trend in a specific time frame. However, the SMMA would rather filter price action noise than reduce the signal lag time. The SMMA changes, moves, and curves much slower than the more popular SMA. A smoothed moving average is a type of exponential moving average with a longer time period of prices used.
The calculation of the SMMA does not contain a fixed time period, it takes the full historical price data series into the formula. The SMMA formula is calculated by subtracting yesterday’s SMMA from today’s price and adding this sum to yesterday’s SMMA, resulting in today’s moving average line.
This technical indicator uses all prices into calculating the SMMA line and uses a long previous time period of data. The older prices on the chart are never completely removed from it’s calculation, although the oldest data has a very low effect on the moving average due to a lower weighting the older the data. With the SMMA lowering the amount of noise priced in to the price it reduces the wilder fluctuations and focuses on showing the primary trend on the chart.
The SMMA can be used to both identify and quantify trends and signal horizontal or vertical support and resistance on a chart in a trend. The smoothed moving average is best used in combination with other indicators for a confluence of signals and for a full view of an SMMA inside the context technical analysis. It is a very slow moving average and better for traders that want to ride a longer term trend with fewer entry and exit signals. The SMMA can be used in the same ways as an SMA or EMA in trading, but with less velocity.
The smoothed moving average (SMMA) formula:
SMMAi = (Sum – SMMAi-1) / N
Answer key:
SMMAi – Is the value of the period being calculated.
Sum – Is the sum of the source prices of all the periods, over which the indicator is calculated.
(Sum = Pricei + Pricei-1 + … + Pricei-N+1)
SMMAi-1 – Is the value of the period immediately preceding the period being calculated.
Price – Is the source (Close or other) price of any period participating in the calculation.
N – Is the number of periods, over which the indicator is calculated.
