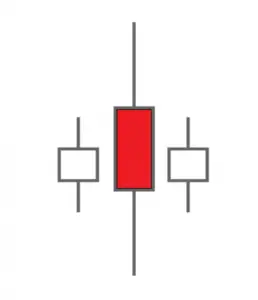
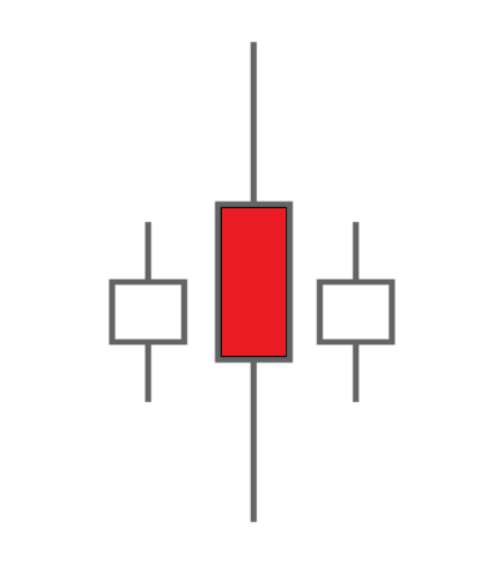
The high wave spinning top candlestick pattern consists of a candle with both a large body and also long wicks above and below sandwiched between small candles both before and after it forms. This candle pattern looks like the combination of a large spinning top and a long legged doji candle put together.
The wide trading range of the middle candle in the pattern signals that the previous trend leading into it has potentially stalled and is now in a price area on the chart of indecision. This candle combination shows a sudden expansion of volatility and then a contraction.
The candlestick pattern is likely showing a chart that is starting a new trading range as it will likely be difficult to break the high or the low price of the high wave spinning top candle for awhile and establish the direction of the next trend. This pattern can be an indicator of a change in the current trend. It is more meaningful when it appears after a strong trend whether a downtrend or uptrend and will be a stronger signal when it is also on increased volume. Candles showing significant volatility on a chart like very long wicks or bodies after a strong trend will signal the probability of reversal or at least the beginning of a new trading range.
The high wave spinning top candle is also called the “Darth Maul”, named after the Star Wars character because the middle candle looks similar to the two sided lightsaber that he used in the movie.

