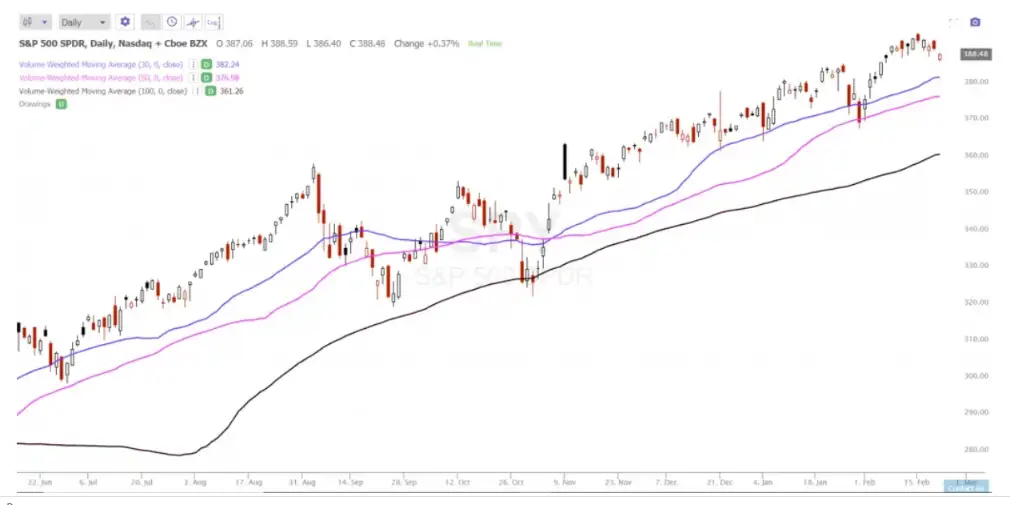
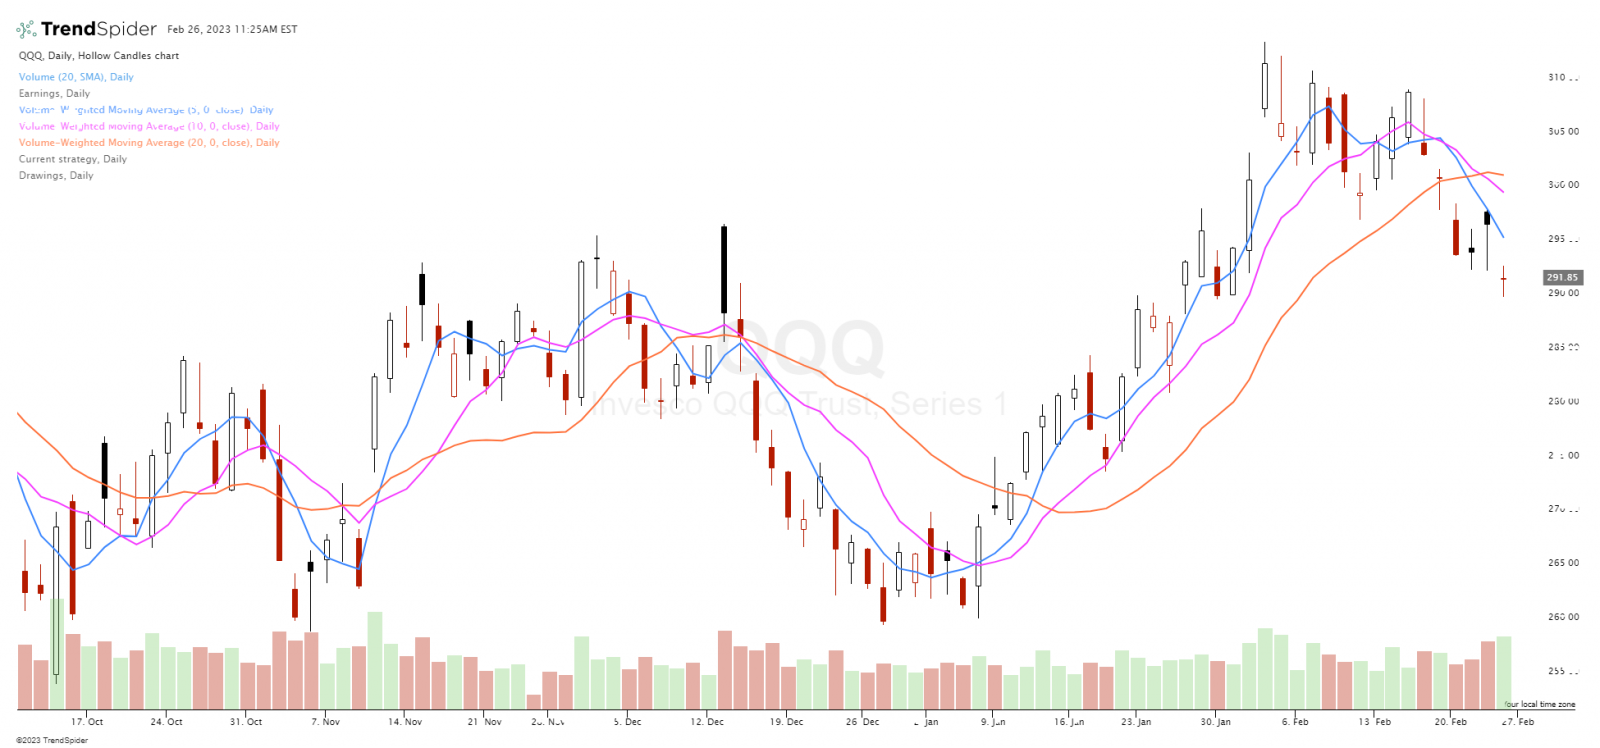
The volume–weighted moving average (VWMA) quantifies the quantity of volume that prices traded at on a chart. The VMWA weighs prices based on the volume of trades in a time frame. The VMWA is represented by a line on a chart that changes as price and volume changes. Traders can use VWMAs for different time frames based on their own system. Areas of specific price action on a chart with more trading activity will receive more weighting in its formula than price zones with less trading activity. In time periods with equal or similar volume on each candle, the simple moving average and the volume weighted moving average can be very similar in value.
The VWMA is not the same as VWAP they are very different technical indicators.
VWAP is a cumulative of the average price with respect to volume. It doesn’t drop off data over time. The calculation begins at the start of the trading session for the time frame being measured and is continually calculated as new data is added.
VWMA is a moving average of price with volume considered inside the formula to weight by quantity of trades that occured at different price levels. It calculates all the price and volume data over the time period of the moving average. The formula begins the calculation at the beginning of the time frame being measured and adjusts as new price and volume data is introduced, older data drops off. The VMWA is a technical indicator that calculates the average of available closing prices adjusted for volume.
The volume–weighted moving average (VWMA) is a very similar tool to the simple moving average (SMA), and the exponential moving average (EMA) and is used as a technical indicator in much the same way to trade trends. However, like the EMA gives more weight to recent prices the VMWA gives more weight to the volume of specific prices. The VMWA can be backtested in the same way as other moving averages and can be used as an indicator of a trend based on which side of the line price is on. A price above the VMWA is bullish for the time frame of the line and could be bearish when price drops below the line for the time frame being traded. A VMWA crossover of two different timeframes can smooth out much of the volatility of using one VWMA on a chart.

Chart Courtesy of TrendSpider.com
