Open range breakout trading is commonly used as a strategy to trade a breakout signal of the first hour of the trading day using an intraday chart. The break of the first hour price range higher can trigger a buy signal and a break down below the low of the first hour of trading can trigger a short sell signal.
The first hour of the trading day can set the key price range for the whole day and also provides some of the highest liquidity with volume for the day. A breakout from this first hour range is one way to possibly identify the trend for the rest of the day. Many times the highest volatility will also occur in the first 60 minutes of the day before settling into a trend higher or lower or just stay in a trading range. It is possible to make or lose money quickly in the first hour due to whipsaws or choppy trading before a direction is established.
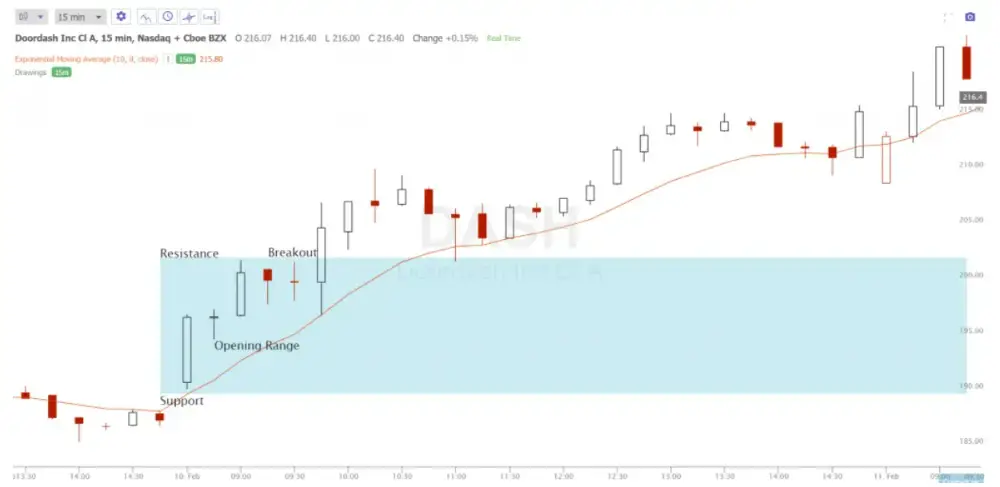
The open range breakout tries to allow the early volatility to pass and the chart to pick a direction by either breaking above the day’s resistance or below the day’s support and moving in a trend or a swing as a directional bias is established on the chart. This is a momentum strategy with the goal of buying high and selling higher or selling short low and covering even lower. If there is no breakout of the opening range, then there is no trade.
The opening range is established by the first 60 minutes of the trading day. An intraday chart is used that can be any increments of minutes a trader decides on, 5-minute, 10-minute, 15-minute, etc. This is a day trading system so the chart time frame must be intra-day and broken down to at least 60-minutes per candle or bar to look for the opening breakout.
To trade this strategy you need to consider which stocks to trade with this signal and whether this strategy worked on the that stock chart historically.
- Stocks you plan on using with the open range breakout strategy need to be backtested to see if it worked historically over the past few months at least.
- Stocks need volatility to make the profits worth the risks.
- The stocks should have enough liquidity for a tight bid/ask spread and to trade with your size. Micro caps, penny stocks, and pink sheet stocks could have issues with fills.
- Stocks in play due to news can provide both the biggest opportunities and the biggest risks. Understand both sides of the coin.
- Position size should be based on a stocks volatility not a desire for big wins.
- Your position size and stop loss should be managed for the maximum loss you want to take as a percentage of your total capital.
- If this is the only strategy you will be using it is important to step away from your computer when the trade has been exited and not go back and take random trades that are not part of your trading plan.
- Once the opening range is established, an automatic buy stop can make your entries quicker than manual execution.
The open range breakout trading strategy consists of these things as part of your trading plan:
- Time frame selection to buy a break out from, the first 15-minute, 30-minute or the most popular 1-hour opening range.
- Plan a stop loss area on the chart to exit a losing trade, it could be if the price drifts back inside the previous open trading range.
- Choose the quantity of shares as the position size of the trade based on the stocks volatility and your stop loss level.
- Use a trailing stop to lock in profits on a winning trade. It can be a close below the previous candle period low on the intraday chart, like 15-minute, 30-minute, or 1-hour candle periods. A moving average could also be used as a trailing stop like a 10-period EMA on the 15-minute as pictured on the below DASH chart.
- Chose a profit target on the chart to lock in profits for big winners using a higher timeframe resistance level, overbought reading, or reward target.
- Stay disciplined to only execute your preplanned strategy and don’t let fear, greed, or ego lead you to stop trading and start gambling. Focus on your edge and stay away from hoping to get lucky.
The open range breakout is a popular momentum day trading strategy that traders can research to see if it fits their own method for trading the market price action.

Chart courtesy of TrendSpider.com
