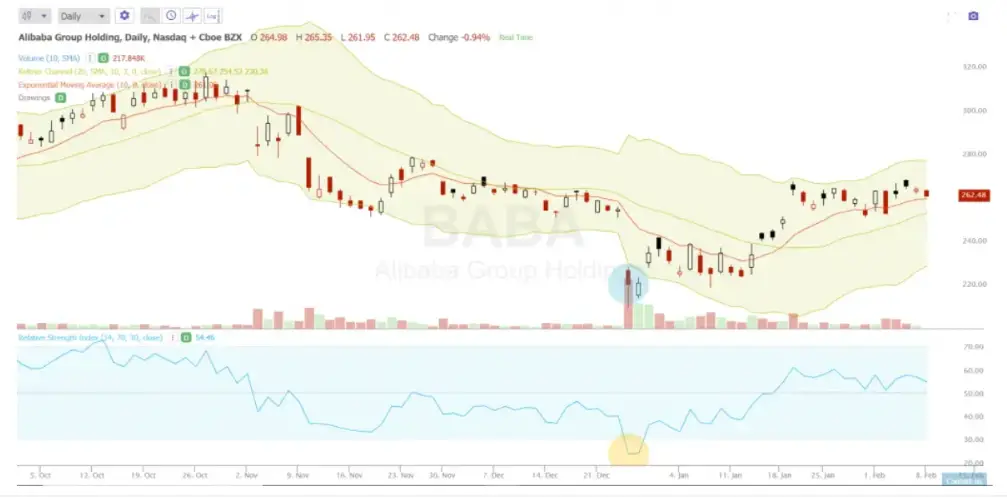
Oversold is a technical analysis term for when the price of a company’s stock is considered too low from a technical view point. Value investors can also measure a stock as oversold from a fundamental perspective of business value.
Oversold stocks are shares in a company that have gone down so far and so fast in price that they are considered to have a good risk/reward ratio for a buy signal. Oversold means an extreme drop in price outside what is considered a normal price range. Oversold conditions are usually found at the end of a larger than normal down swing in price or at the end of a sustained downtrend.
Here are ten things to look for when buying a deep dip into oversold technical territory on a stock chart.
- An RSI reading of under 35 begins to show a stock went down too far and too fast and could be due for a reversal back higher. A 30 RSI dip buy level that holds as end of day support can be ideal. A drop below 30 RSI can be a signal of even lower prices to come.
- A stock price that moves greater than three deviations form the mean can be due to bounce back inside the normal range of price action. This can be three deviations from the center line of a Keltner Channel.
- A drop outside a standard Bollinger Band to the downside is one signal of the potential of an oversold chart.
- The farther away price moves away from the 10-day exponential moving average the greater the odds of a snap back to this line.
- The 20-day moving average is the line of technical value and price action tends to return to this average price over time, this is consider a reversion to the mean or return to value. When price is over three ATRs from the 20-day moving average it is like a rubber band stretched due to snap back.
- Lows in price based on the above technical levels many times have a bounce confirmed with a large increase of volume.
- Oversold stocks tend to bounce when news is the worst and everything negative is already priced in.
- An oversold stock can bounce as short interest becomes dangerously high and they all need to cover. 40% short interest on a stock can even begin to be bullish at those extremes.
- A stock that gets sold off so much it is in the single digits can create a good risk reward ratio if the business is not in danger of bankruptcy.
- Oversold stocks bounce at the point that sellers find equilibrium after a new trading range is established, this sets up the possibility of a breakout of a range to the upside.
Oversold stocks can continue to go lower so it is still important to see a confirmed support level and use a stop loss. The potential of these types of setups are in the great risk/reward ratios they can create. The best odds of success for this set up is with stocks that are also leading companies with great fundamentals.

Chart Courtesy of TrendSpider.com
