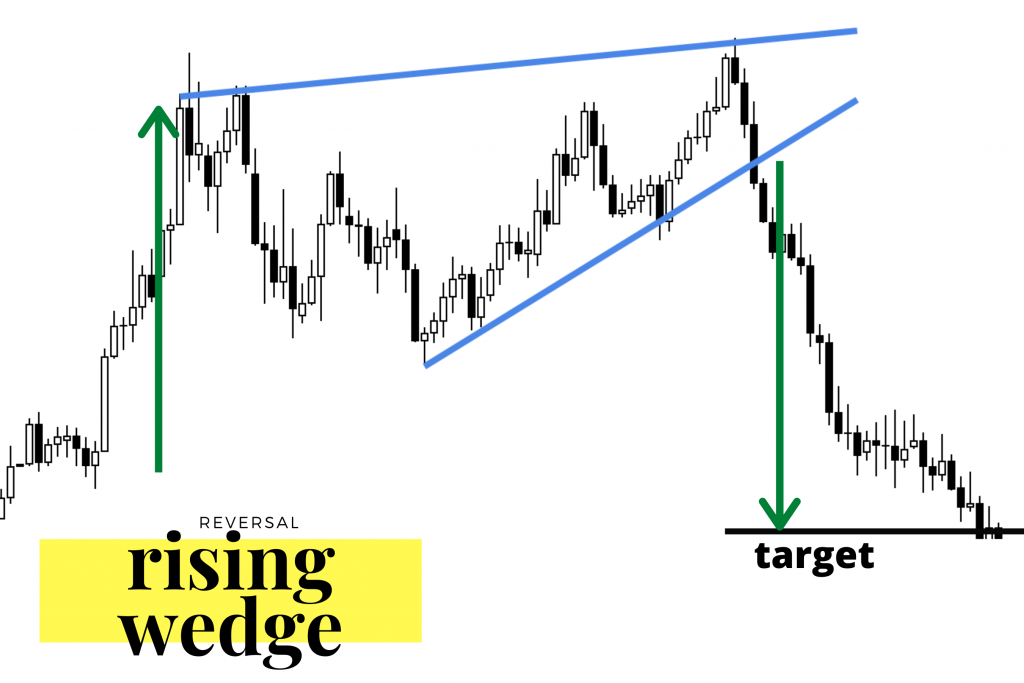
The rising wedge chart pattern can fit in the continuation or reversal category. When it is a continuation pattern it will trend up, however the slope in the wedge will be against the overall market downtrend.
- The rising wedge is a bearish pattern regardless of what kind of market it appears in.
- The rising wedge is a bearish chart pattern that begins with a wide trading range at the bottom and contracts to a smaller trading range as prices trend up.
- This price action forms an ascending cone shape that trends higher as the vertical highs and vertical lows move together to converge.
- The bearish bias in this pattern can’t be signaled until a breakdown of the ascending support to show this is a reversal pattern from highs in price.
- This is a longer term pattern that generally forms over a one to six month timeframe.
- The new highs set in this pattern create higher highs, but the new highs should become less in magnitude. Less strength in highs indicate a decrease in the strength of buying pressure and should create an upper trend line of resistance with less ascending slope than the lower line of support.
When it is a reversal pattern, the rising wedge trends up when the overall market is in a downtrend.
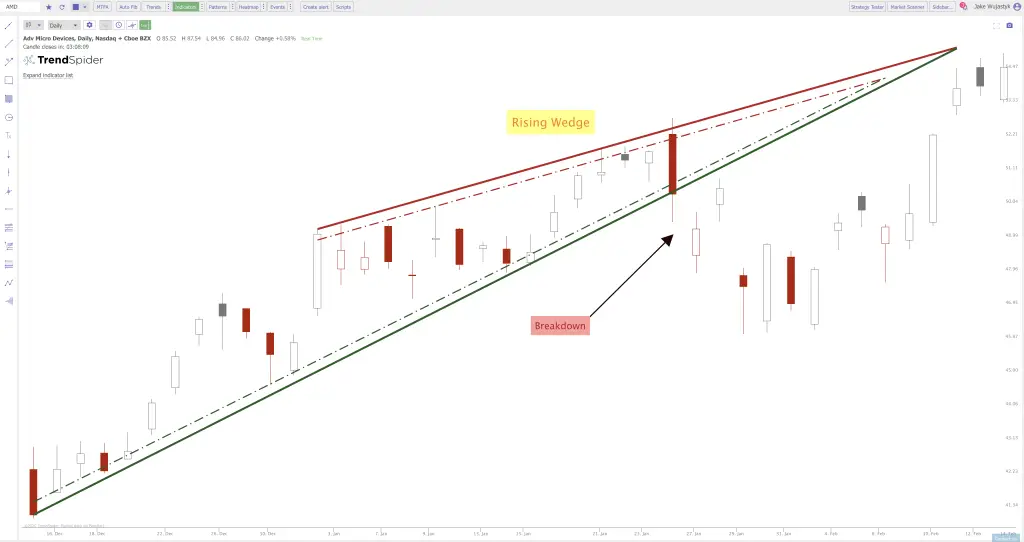
Image courtesy of Colibri TraderThis Advanced Micro Devices chart shows a rising wedge forming in January following an upswing in price. It did have a sharp breakdown in the ascending lower support line and a fast swing down in price before continuing its sharp move to the upside.

