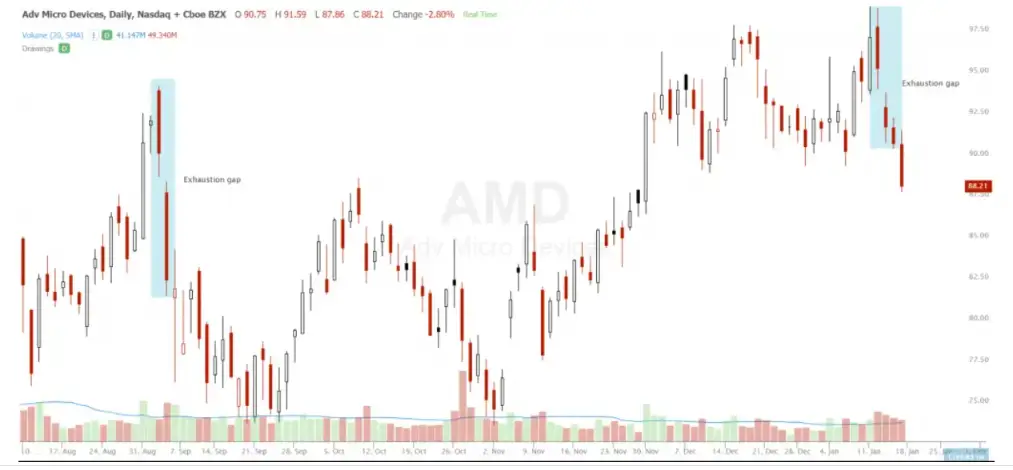
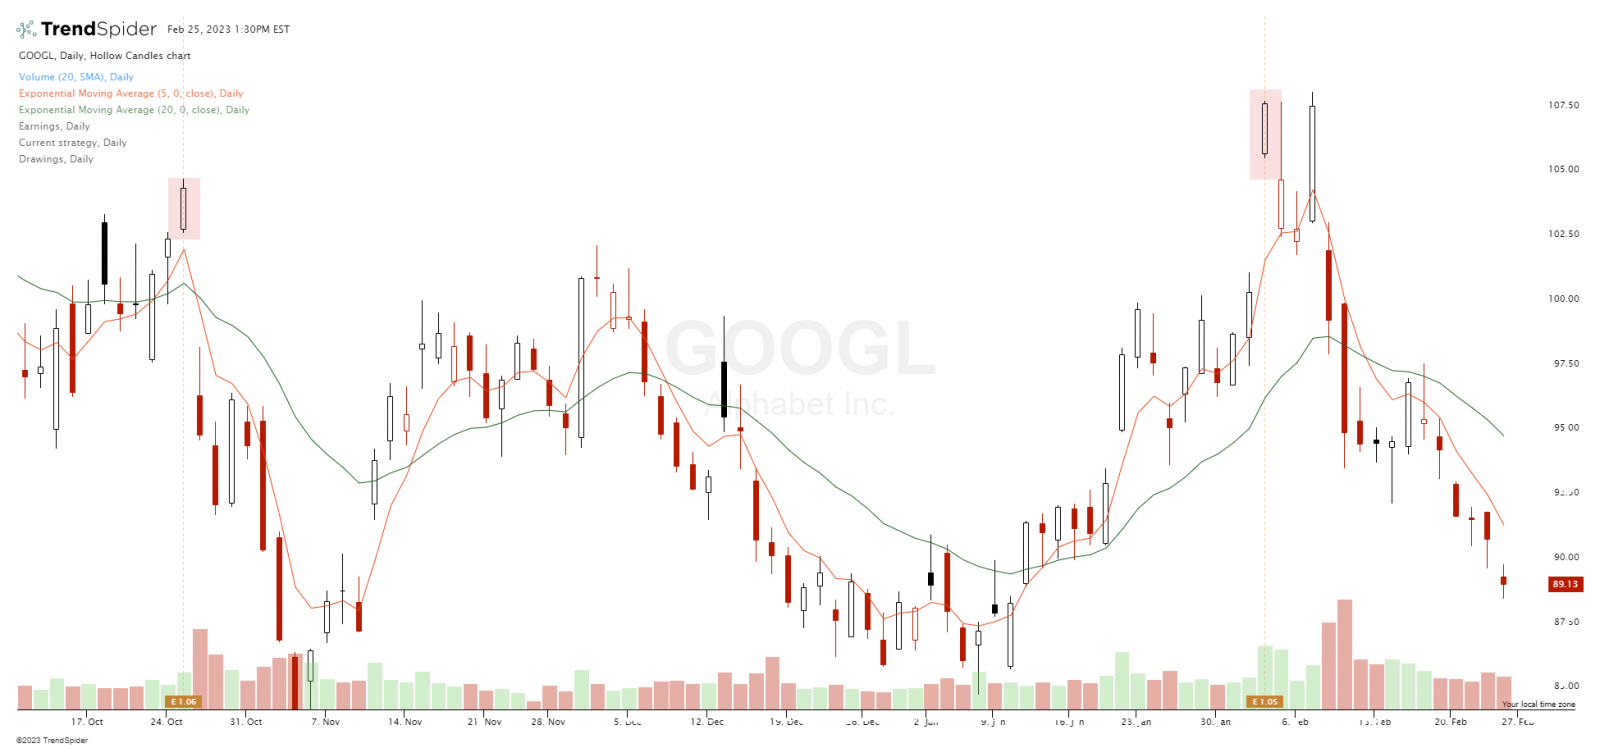
An exhaustion gap is a bearish reversal signal on a chart that occurs after a sharp move higher. An exhaustion gap happens near a high in price on a chart when a space forms between a closing price and a lower opening price. This pattern generally has the most meaning on a daily chart. This sharp fall in prices shows a quick shift from buyers to sellers having control by bidding down price at the beginning of the daily candle during the gap. This is a very bearish indicator of a move lower based on technical analysis.
The exhaustion gap signal shows that the supply and demand for the stock has shifted to selling pressure. The probabilities shift to prices going lower after the gap occurs and the odds of even lower prices increases as the candle moves lower after the gap.
- This signal shows a huge shift in momentum from going up to going down fast.
- The exhaustion gap should happen on higher than normal volume for stronger confirmation.
- This chart pattern is called an exhaustion gap as it visually shows that that buyers are tired of buying at higher prices and so exhausted that they are not able to hold prices up and sellers take over with a gap down and run the chart much lower.
- An exhaustion gap should be preceded with several days, weeks, or even months of an uptrend in prices making new higher highs.
- A large gap between the low price of the previous day and the opening price of the current day is the primary visual signal for this pattern.
An exhaustion gap lower in price is both a warning to close short positions on the open as well a new potential short sell signal for positions betting on lower prices. This is an extremely bearish signal showing and absence of buyers in the price gap as well as a complete change in a charts upward trend.

Chart courtesy of TrendSpider.com
