Buy and hold investing itself is not valid on the majority of individual stocks. Buy and hold works on indexes like the S&P 500 because these indexes are diversified and contain the future biggest winning stocks. Warren Buffett also recommends this strategy as a way to beat the majority of mutual fund managers and hedge fund managers for returns over 10 year periods of time. Most financial advisers recommend this buy and hold strategy to clients with 10-30 year time frames.
The downside to buy and hold on the S&P 500 index is the financial and mental pain that has to be endured during bear market drawdowns and market crashes. The other issue is that as you accumulate your position and then sell it you are timing the market and if you start buying during a bull market peak or need to exit during bear market bottoms it dramatically changes performance. A buy and hold investor that started buying in March 2000 or January 2008 will not think it is as great a system a few years later as someone that started buying in March of 2003 or March of 2009. Could there be a better way to manage the risk and timing of buy and hold without sacrificing the long term returns? Or better yet increasing the returns and lower the risk?
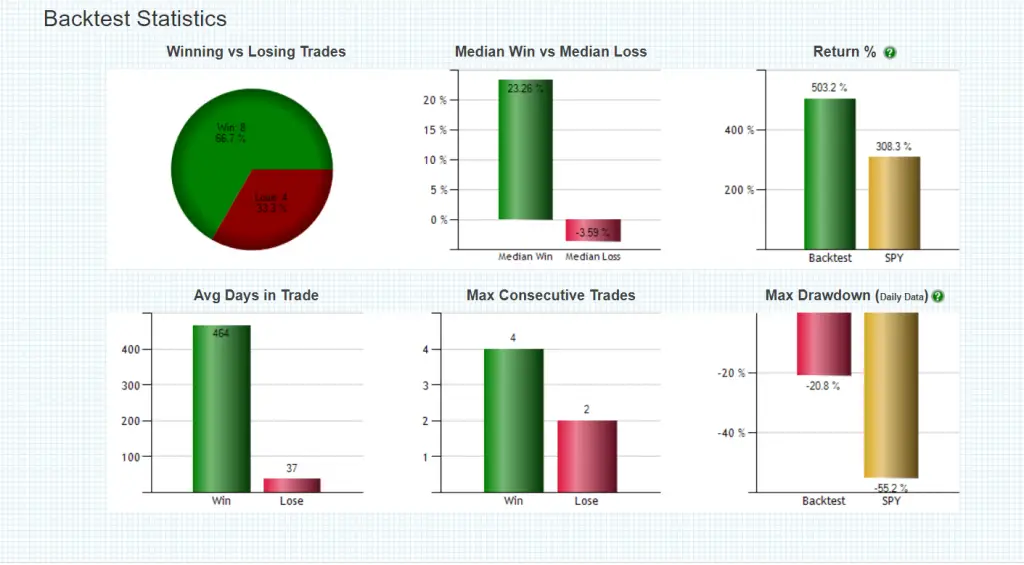
There is a simple moving average strategy that beat buy and hold investing over the past 20 years. It is not complicated, it is a type of trend following system and only takes one action on the last day of the month to execute it. It almost doubled the returns in the S&P 500 index and cut the drawdown of capital by nearly one third of buy and hold. Unlike mutual funds and hedge funds, a good systematic moving average strategy can beat the S&P 500 index over time by staying long during bull markets and going to cash during bear markets.
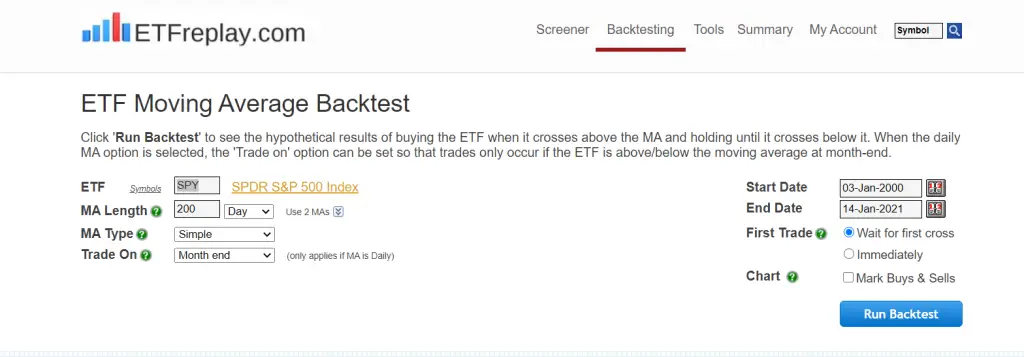
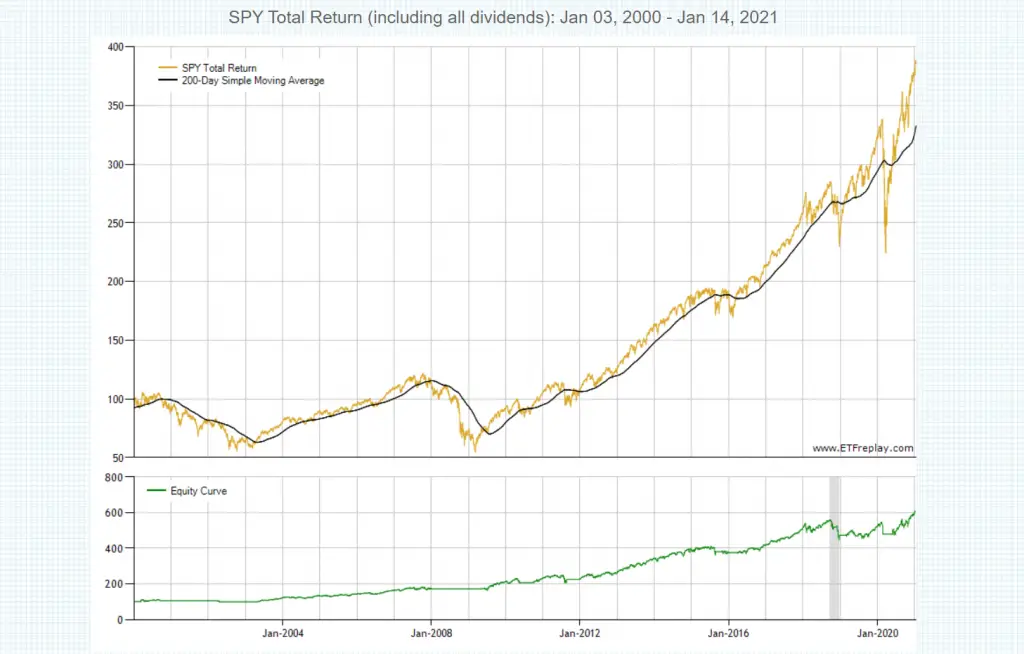
The 200-day simple moving average of prices is one of the most popular stock market signals and backtesting shows since the year 2000 it has worked best as an end of month signal. Below are the results if an investor simply bought the $SPY ETF and held if price ended the month over the 200-day simple moving average but sold and stayed in cash if the $SPY price was under the 200 day SMA on the last day of the month. This is not the Holy Grail of trend trading the SPY ETF, it is just math. The 2oo-day SMA is lost during bear markets as price falls below it and price also stays above the 200 day SMA during bull markets as it continues to trade in a range or trend higher.
The end of month signal also avoided all the intra-month false signals when price chops under and over this line. For a swing or position trader the signals will seem like a long time frame but for a buy and hold investor this will seem like an active short term strategy.
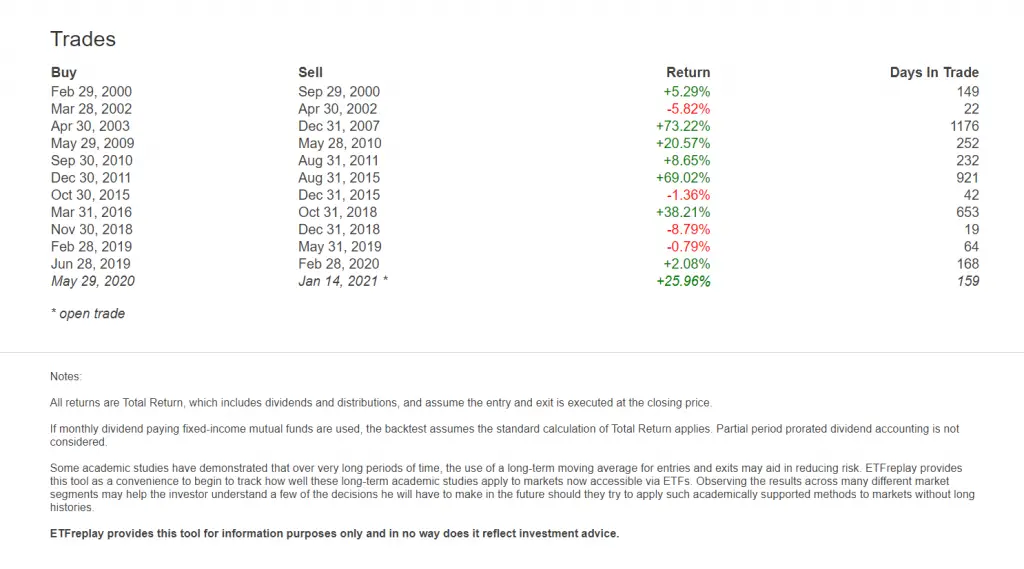
The market timing of the trade signals of the below 12 trades does not get much better than this avoiding the three major bear markets of the past 20 years but outperforming the bull market buy and hold profits by almost +200%.


Backtest data courtesy of ETFreplay.com.
If you are interested in learning more about using moving averages in your trading or want to see how other mechanical moving average signals work you can check out my following educational resources.
Here are my four moving average books:
Here are my two moving average eCourses:
This post is not investment advice it is for informational purposes only.