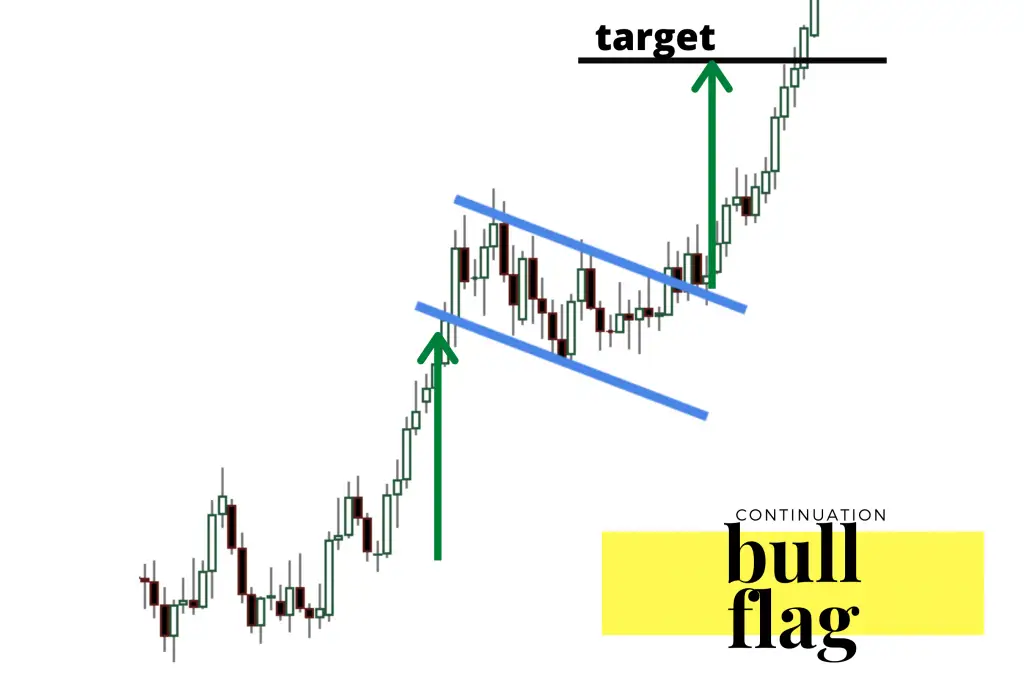
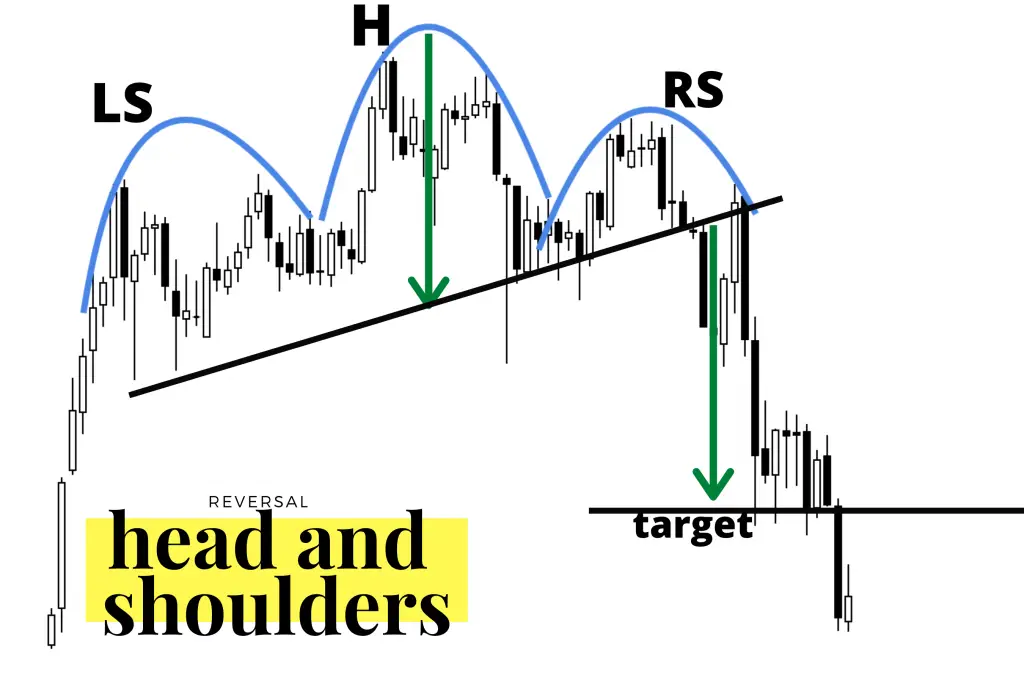
According to Thomas Bulkowski, the best performing and also most likely to be profitable chart patterns are: bullish flags that are high and tight that breakout to the upside and complex head and shoulders top chart patterns with breakouts to the downside. His picks are based on his exhaustive research and backtesting price action on chart patterns.
High and tight bull flag chart facts:
- The high tight bull flag is a version of the standard bull flag that requires a much stronger trend and a tighter price base for the flag.
- It is a continuation pattern of the previous uptrend before the flag.
- Price should rise at least 90% or double in the 2 months or less before the flag price range forms.
- A consolidation price range pattern forms after the large uptrend. The price range can look like a flag or a pennant or just a pause a base in the rising price.
- Volume should decline as the price range in the flag forms.
- The ‘pole’ is represented by the previous uptrend in price before a price consolidation.
- The ‘flag’ is a rectangular descending price range after the uptrend to new higher prices stops. The flag has primarily lower highs and lower lows.
- The signal of the end of the flag pattern and the beginning of a new potential uptrend is when the descending upper trend line is broken with a move upwards in price.
- This pattern is thought to be the consolidation of the uptrend.
- Traditionally the move out of the flag is thought to be potentially as big in magnitude as the uptrend before the flag begins.
- The completed pattern is validated when price closes above the highest price in the pattern, which is almost always the peak of the flag.
- A breakout of the flag with higher than normal volume increases the chance of a continuation of the uptrend.
- A stop loss can be set at the lower trend line in the flag after entry.
- Of course this pattern does not work every time but when it does it can set up a huge win, but with all set ups much of the edge comes from creating a good risk reward ratio through an initial stop loss to manage risk and a trailing stop to maximize a gain.

Complex head and shoulders top chart pattern facts:
- The complex head and shoulders top chart pattern is a variation on the traditional head and shoulders as it can have multiple shoulders or heads during the formation.
- It is a reversal pattern of an uptrend. The pattern is formed during a bull market or a chart in an uptrend and the completion of this pattern is bearish and is usually a set up for a pullback, correction, or bear market. A previous uptrend must be in place before this pattern can be considered valid.
- A complex head and shoulders top can form multiple shoulders or multiple heads, but almost never both.
- Multiple shoulders should have tops near the same price, be approximately the same distance from the head, and look like the same type of shape whether wide or narrow in comparison to their coinciding opposite in the pattern.
- This pattern can consists of four to six price peaks with the middle higher peaks creating one or multiple ‘heads’ and each smaller peak is a ‘shoulder’. The low of support that creates the valleys between all the peaks is used to signal the horizontal support which is the ‘neckline’.
- This pattern is commonly higher on the left side of the chart pattern than the right side peaks.
- The break of the neckline support to the downside is the signal line to sell or sell short.
- The left shoulder or shoulders is created during the first swing up in the uptrend. Price then pulls back to support on the downswing.
- The next upswing in price goes higher than the left shoulder and breaks out to a new higher high but eventually swings back down to near the previous low price of support.
- The third swing up in price is lower than the middle peaks that are the ‘head’ or ‘heads’ and similar in size to the first high in price that creates the left shoulders. Price then swings back lower for the third time near the previous two areas of support.
- The three to six swing backs to low price support should be similar to create a horizontal support line that is the neckline in this pattern. This line can be very flat or trend up or down. A neckline that is trending down is another indicator of the end of the uptrend.
- This pattern should see declining volume to the upside of the head and shoulders and increasing volume as it swings lower after each peak to give additional signs of distribution.
- The head and shoulders pattern is not confirmed until the neckline of the pattern is broken. Many times the old support at the neckline becomes the new resistance as price tries to rally back up after the break down. Increasing volume on the break below the neckline is more confirmation of the potential for a downtrend.
- The magnitude of the move down can many times be the same magnitude as the distance from the neckline to the top of the head in the head and shoulders pattern.
- The second best bearish chart pattern that Bulkowski discovered was the standard head and shoulders top so they can both be used interchangeably for similar results and the complex version of the pattern is much more rare to see.
- Of course this pattern does not work every time but when it does it can set up a huge win to the downside, but with all set ups much of the edge comes from creating a good risk reward ratio through an initial stop loss to manage risk and a trailing stop to maximize a gain.

Image by @PriceinAction
For a deep look at all the most popular chart pattern you can check out my book The Ultimate Guide to Chart Patterns available on Amazon.