Own work, CC0, via Wikimedia Commons
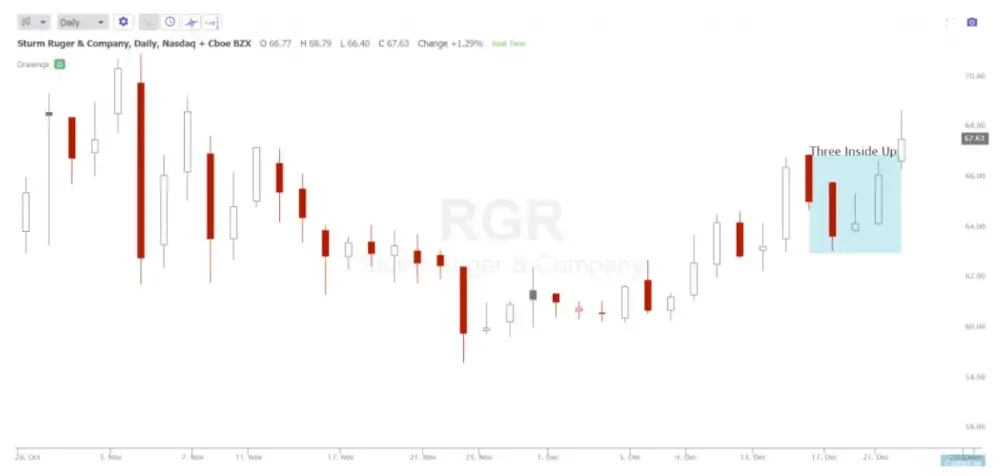
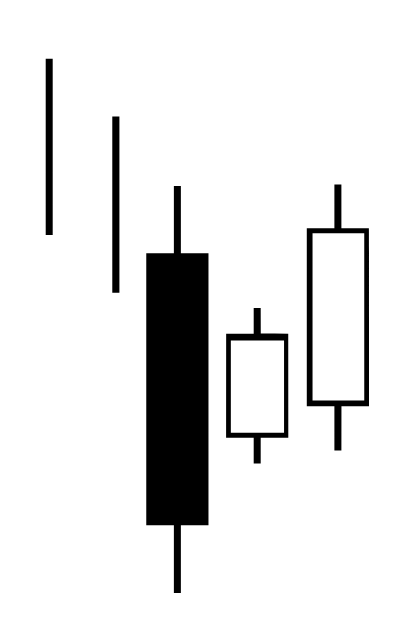
The three inside up candlestick pattern is a bullish momentum signal on a chart. It is formed when a large bearish candle is followed by a smaller bullish candle that has its range inside the previous bearish candle, then the third candle is bullish and closes above the second candle.
This pattern signals the potential beginning of momentum higher at least in the short-term and can lead to a swing back to the upside, a new uptrend, or at least sideways price action. This pattern has meaning in relation to the area it happens on a chart to give it context. In a downtrend it can be a reversal signal to the upside, in a price range it can signal the beginning of a new uptrend, and in an uptrend it can signal a continuation of the uptrend in price after a pullback. The odds of the three inside up candlestick pattern is much greater of working as a bullish signal if it forms near price support on a chart, and oversold area like the 30 RSI, or a key long term moving average like the 50 day or 200 day.
This pattern begins with a big down candle that shakes out a lot of sellers at the lows. The next candle opens higher than the previous lows and holds the lows of the previous day showing no sellers are at lower prices. The second candle also closes higher than its own open, confirming a potential reversal off the lows. This price action signals to existing short sellers it may be time to buy to cover their positions as the lows hold. The last candle finishes the pattern and signals new bullish momentum.
This patterns gives a potential buy signal at the end of the third and last candle as it closes higher than the middle candle. A potential stop loss can be set for the loss of the third candle lows. A profit target for the trade could be set at the 70 RSI and the trailing stop could be a close below the previous day’s low if it starts to trend higher.

Chart Courtesy of TrendSpider.com
