This post is an example of one of the chapters in my new book ‘The Ultimate Guide to Chart Patterns‘.

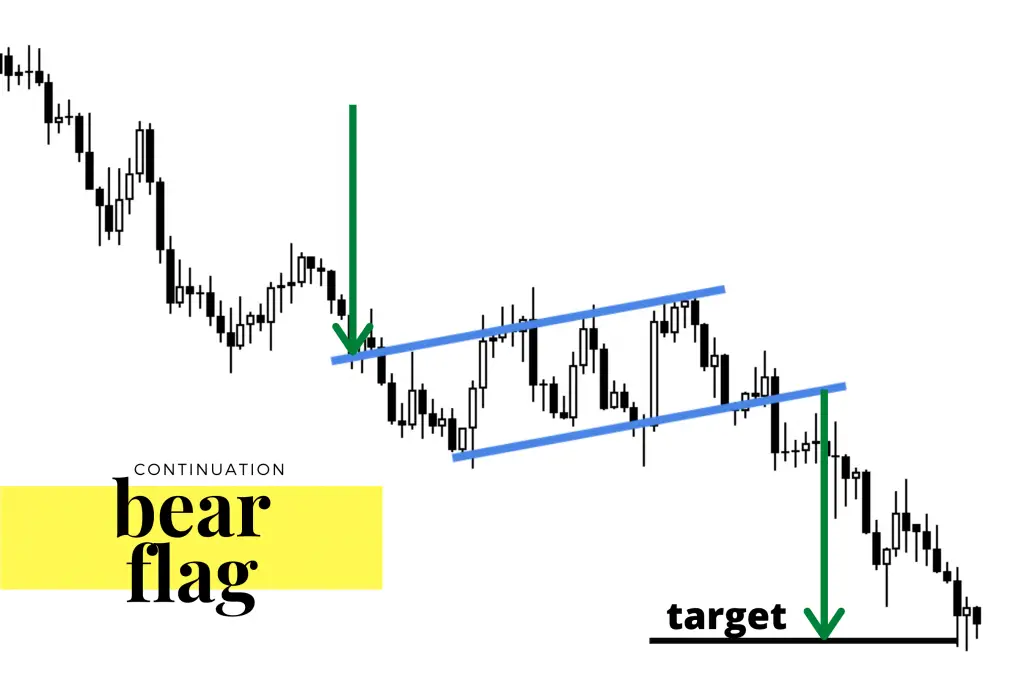
Image by Atanas Matov
Chart Facts:
- The bear flag pattern is a continuation pattern of the previous downtrend.
- A bear flag chart pattern occurs after a downtrend showing that a new price base failed to hold support.
- The ‘pole’ is represented by the previous downtrend in price before a consolidation.
- The ‘flag’ is a rectangular ascending price range after the downtrend to lower prices stops. The flag generally has higher highs and higher lows.
- The signal of the end of the bearish flag pattern and the beginning of a new potential downtrend is when the ascending lower trend line is broken with a new move downwards in price beginning.
- This flag pattern is thought to be a failed reversal to the upside after a consolidation of price in the downtrend breaks its price support.
- Traditionally the next leg of the move down out of the flag is thought to be potentially as big in magnitude as the downtrend before the flag begins.
- A breakdown of the flag with higher than normal volume shows distribution and increases the chance of a continuation of the downtrend.
- If a short position is entered on the flag support breakdown a stop loss can be set with a tight stop on a price rally back into the trading range of the flag or the higher trendline in the flag.
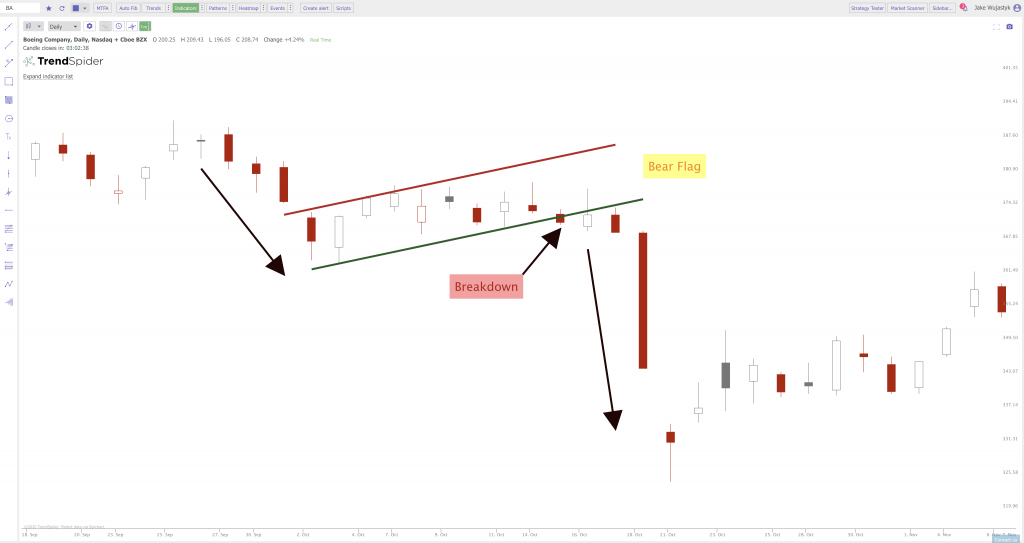
Below is an example of the Boeing chart in a two-week bear flag after a previous downswing in price. The chart shows that a trend of lower lows started to emerge day after day before the price had a sharp break to the downside out of the bear flag. Some of the clues to the potential of a new leg of the downtrend was the four out of six days bearish red candles before the big red candle sell off after the bear flag broke.
Four days of consecutive lower lows occurred before the formation of the bear flag started. After the breakdown of the bear flag price fell dramatically and volatility increased. After one more drop in price the chart stopped going lower and the next price range held and rallied. This bear flag and the bearish candles were a warning sign before the big plunge in price.

Chart by Jake Wujastyk at TrendSpider.com
Chart Summary:
A bear flag is a powerful bearish chart pattern that is found during chart downtrends and bear markets. Many times these chart patterns are formed in growth stocks and market sectors in distribution. As market cycles change this pattern can go parabolic to the downside with oversold technical indicators can be of little help in finding a bottom in price. The downtrend after the bear flag is many times close to the same magnitude as the downtrend before the bear flag formed.
If you are interested in learning more about Chart Patterns check out my new book ‘The Ultimate Guide to Chart Patterns‘ available on Amazon.