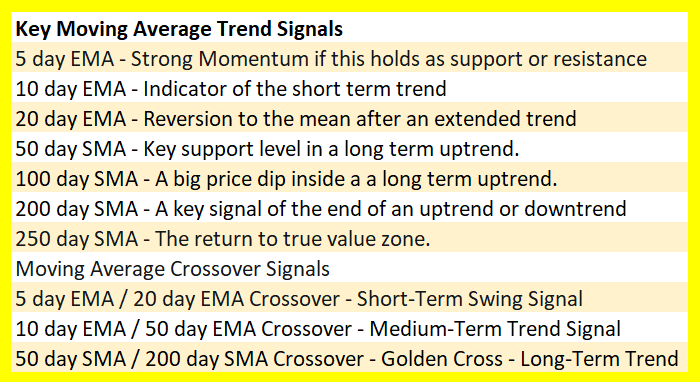
 What are the most used moving averages on charts and in technical analysis?
The popularity of specific moving averages on different time frames can give them meaning as more people are watching them for signals. They can be self fulfilling prophecies as buyers and sellers take action as price crosses the line.
Overall, simple moving averages are used more than exponential moving averages on charts and when making trading decisions. Most new traders start with simple moving averages when they start. The charting platforms that have default settings commonly use simple moving averages on their basic charts.
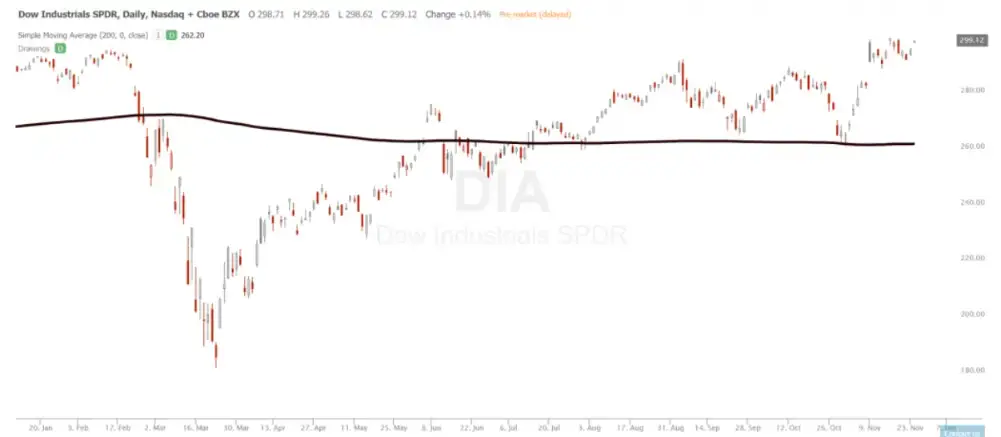
The most popular moving average used in technical analysis is the 200-day simple moving average. Even financial news channels will discuss the line when it is lost or retaken by price on a chart. This is one of the biggest signal lines many investors and traders watch to see if bulls or bears win and it becomes support or resistance. Even legendary trader Paul Tudor Jones mentions it in one of his trading lessons.
“You always want to be with whatever the predominant trend is. My metric for everything I look at is the 200-day moving average of closing prices. I’ve seen too many things go to zero, stocks and commodities. The whole trick in investing is: “How do I keep from losing everything?” If you use the 200-day moving average rule, then you get out. You play defense, and you get out.” – Paul Tudor Jones
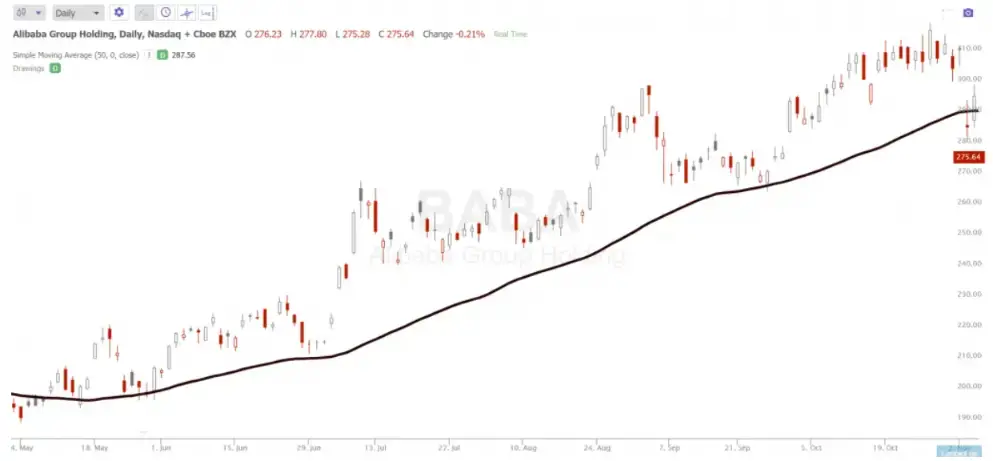
The second most popular moving average would have to be the 50-day simple moving average. It is a focus for many growth investors and traders, even the legendary stock trader William J. O’Neil used it on his charts. This line is used in the CAN SLIM method at times to buy a pullback in a leading stock when it is in an uptrend and the 50-day simple moving average is ascending.
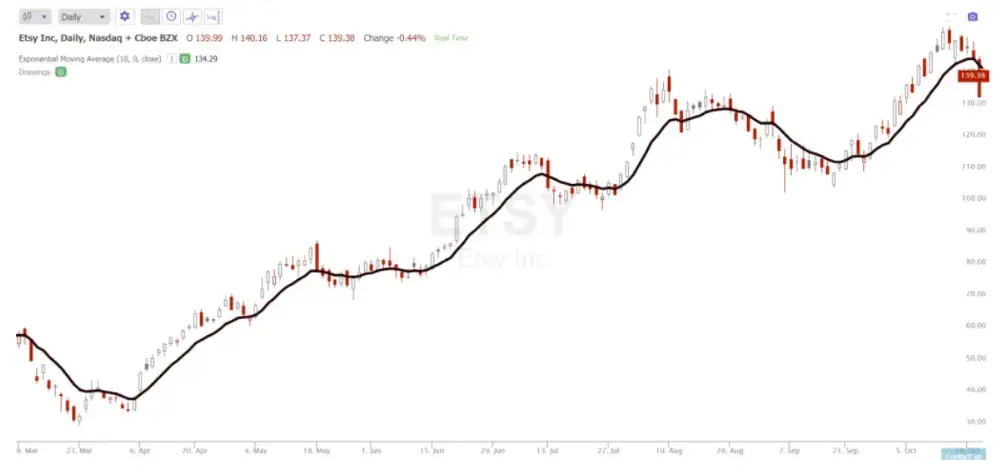
The third most used moving average in my experience is the 10-day exponential moving average. I have seen this used on charts by day traders and as part of moving average crossover signals for trend traders when combined with the 50-day EMA or 30-day EMA. I have used it as a trailing stop in my own swing trades also. The 10-day exponential moving average was made popular in a quote from one of the most successful day traders of all time and Market Wizard Marty Schwartz.
“The 10-day exponential moving average (EMA) is my favorite indicator to determine the major trend. I call this “red light, green light” because it is imperative in trading to remain on the correct side of a moving average to give yourself the best probability of success. When you are trading above the 10=day, you have the green light, the market is in positive mode and you should be thinking buy. Conversely, trading below the average is a red light. The market is in a negative mode and you should be thinking sell.” – Marty Schwartz
On the weekly chart the most commonly used moving averages are usually the 10-week moving average and the 40-week moving average as they are very similar to the 50-day moving average and the 200-day moving average.
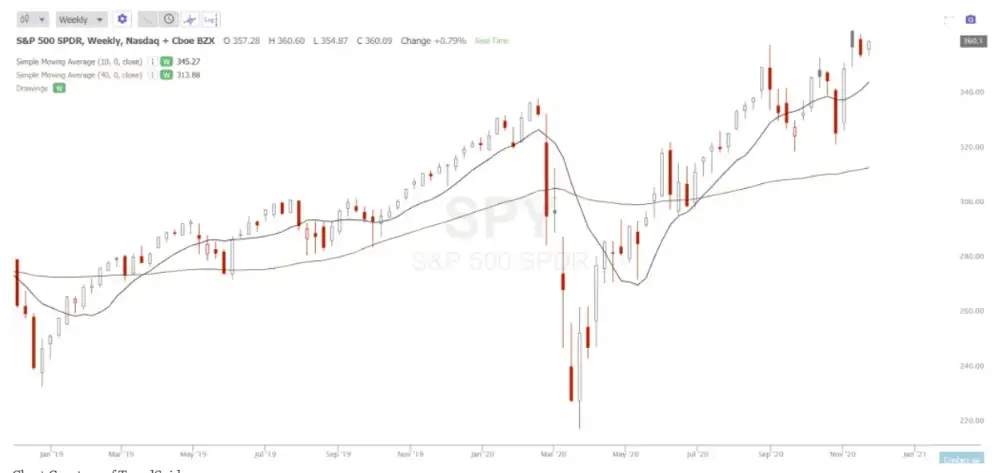
Chart courtesy of StockCharts.com
If you want to learn more about how to use moving averages in your trading here are my four moving average books:
Here are my three moving average eCourses: