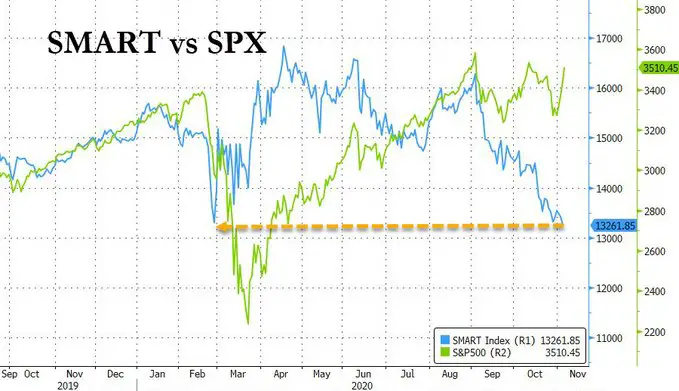
Smart money flow index or smart money index (SMI) is a technical analysis indicator that attempts to show the current market sentiment of investors. The index was created and made popular by Don Hays, who was a money manager. The SMI indicator uses intraday price patterns to measure bullish or bearish sentiment.
The SMI indicator is based on the theory that many traders are both emotional and react strongly to overnight headlines and new economic reports at the beginning of the trading day in the futures market, pre-market , and the opening bell. At times there is high volume buying with market orders and short covering at the opening bell in the stock market that can show investors and traders overreaction in the morning. The basic strategy using the smart money flow index is to trade against the morning price move and trend and trade with the evening price trend. The SMI can be calculated for several markets and market indices like the S&P 500 and Dow Jones Industrial Index.
The basic SMI formula is:
Today’s SMI reading = yesterday’s SMI – opening gain or loss + last hour change
One example is if the SMI closed yesterday at 10,000. During the first 30 minutes of today’s trading, the Dow Jones Industrial Index has gained a total of 100 points. During the last hour, the DJIA has lost 80 points, today’s SMI is 10000 – 100 + -80 = 9820.
The smart money flow index shows no clear signal if a market is bullish or bearish. It has no fixed absolute signals for the direction or momentum of the current trend. SMI dynamics have to be looked at in current relation to the market behavior. If the SMI goes up a lot when the market drops, this could mean that the ‘smart money’ is buying, and the chart could be ready to move higher. The inverse is with a rapidly dropping SMI in a bullish market it could mean that the ‘smart money’ is selling and that the chart could be ready to fall lower. The SMI is a trend indicator within the context of current price action. This indicator was designed to be used on daily charts only.
Smart money flow selling now greater than at the March crash lows pic.twitter.com/UDE2Ci8Do4
— zerohedge (@zerohedge) November 6, 2020
The Smart Money Flow Index – Sell Of 2018 & Botton 2019 pic.twitter.com/DOw3haP0yL
— Víctor Sánchez (@economicthinker) November 17, 2020
