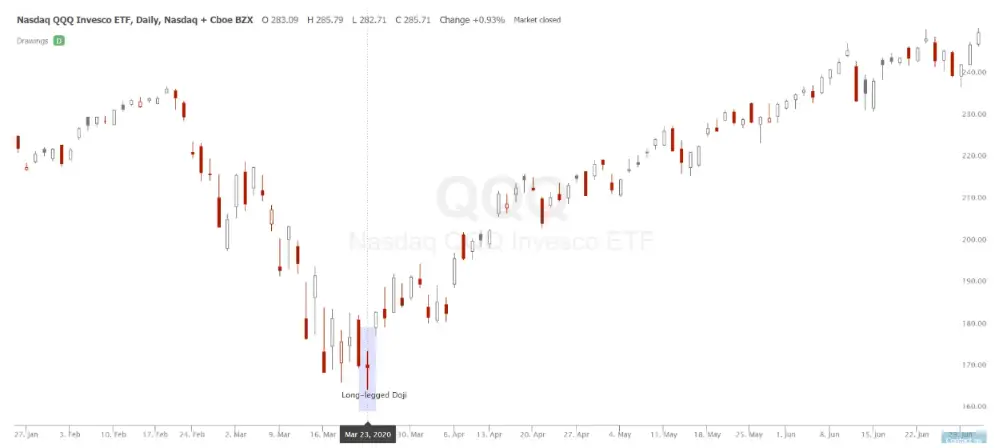
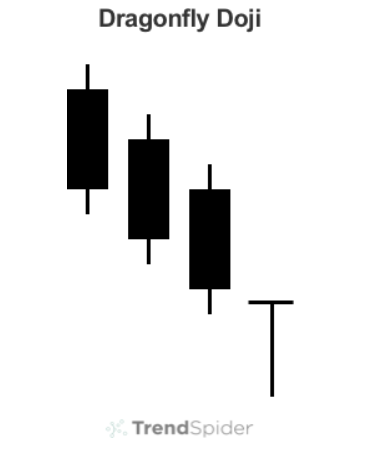
A Dragonfly Doji is a single candlestick pattern that is a type of doji where the wick (or shadow) of the candle is much longer than the body. The large wick represents a large trading range during the candle time period and the small body represents the open price and closing price being very close together. It is created when the candle’s open, close, and high price are very close together or the same while the intraday trading moved far from the open but reversed back to close near where it started which is also near or the high of the day.
A Dragonfly Doji can be a signal of a potential reversal in the current downward direction of price action on a chart if it happens during an oversold downtrend. The long lower wick shows that there was selling pressure during the time period of the candle, but price reversed strongly to close near the open as the buyers stepped in at lower prices and bid the chart back up to where it started. This is a signal of a key reversal on a chart during a downtrend showing that the next swing could be up in price as lower prices were absorbed and rejected.
A Dragonfly Doji is a key trend reversal signal and indicator. High trading volume in correlation with the candle increases the probability of success. When a chart has been in a downtrend and moves to a new low in price that’s lower than the last three trading days, then fails to hold that low, but then rallies to close in the upper 10% of the day’s overall trading range, there can be good odds that was the low and the chart has begun a new upswing in price.

Courtesy of TrendSpider.com
