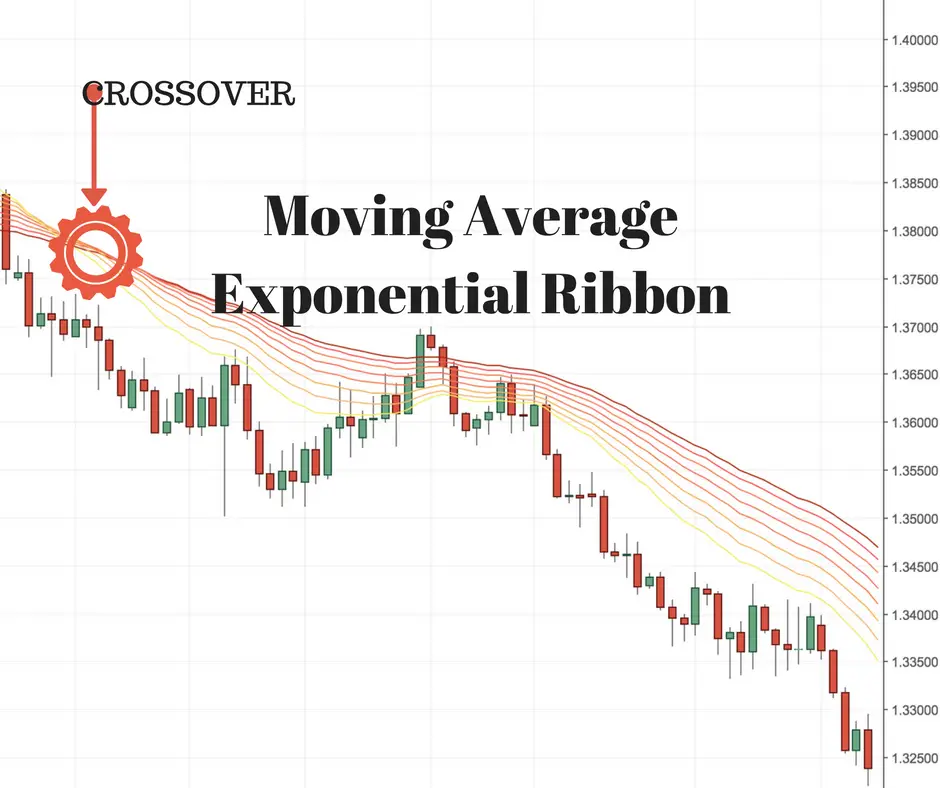
Moving averages are not predictive they are reactive to price action. They show trends on charts when they go vertical and can show that price is in a range when a moving average is horizontal. Moving averages are technical trading tools.
The answer to “Which moving average is best?” is the question “What’s your time frame?”
Traders react in different time frames using the chart length for the time period of their trade.
Scalpers will focus on 1-minute charts and lower, day traders commonly trade on 5-minute and 15-minute chart setups.
A combination of the 5, 10, and 20-minute moving averages can be a great place to start with a chart for day trading strategies. Backtesting relative price action relationships between these moving averages from a historical perspective can help find an edge on the intraday chart. Moving average vertical slopes up or down can show the current intraday direction of price.
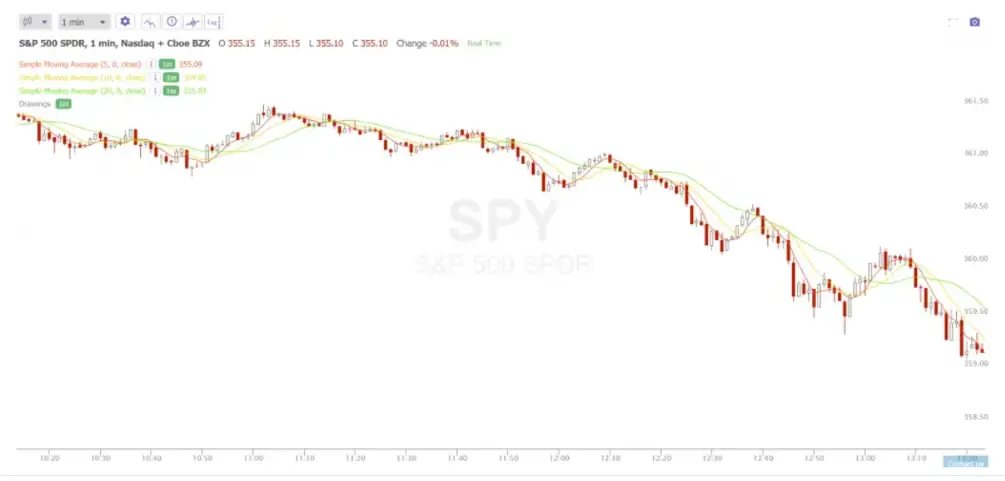
Short-term overnight traders might use 1-hour charts. A trader may take a 5/20 or a 10/20 hour crossover or cross under for a very short term trade over hours or days.
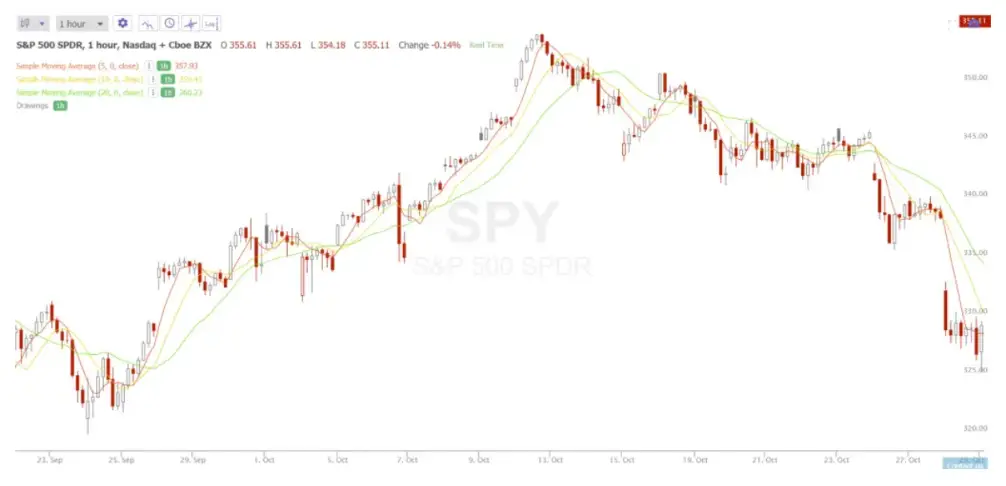
The best moving average for day traders and short term traders will be the one that fits their own intraday time frame and the average time they want to hold a trade for scalping or day trading whether it is 1-minute, 5-minute, 15-minute, or an hour there is no universal answer, a trader needs to see what works best for them, moving averages with 5 multiples is a great place to start research: 5, 10, 15, 20, 25, etc.
Swing traders primarily use signals off daily charts for trades over multiple days. Trend traders are looking at daily charts but with longer term moving averages for trades over days, weeks, and sometimes months. Some of the most popular moving averages most commonly used on charts are the 5-day, 10-day, 20- day, 30-day, 50-day, 100-day, 200-day, and 250-day moving averages.
Which moving averages are the best for the daily chart?
Let’s start with the exponential moving average versus the simple moving average. What moving average is Better the SMA or EMA?
If a trader is using longer term moving averages like the 50-day, 200-day, or 250-day then the simple moving average will most likely give the most accurate level for trading bounces and resistance off that key level. If a trader is using crossover signals then the exponential moving average will probably give more of an edge by getting in and out of a trend or momentum trade faster than a simple moving average. When I completed backtests for most charts historical price data the EMA almost always beats the SMA in profitability on signals for entries and exits.
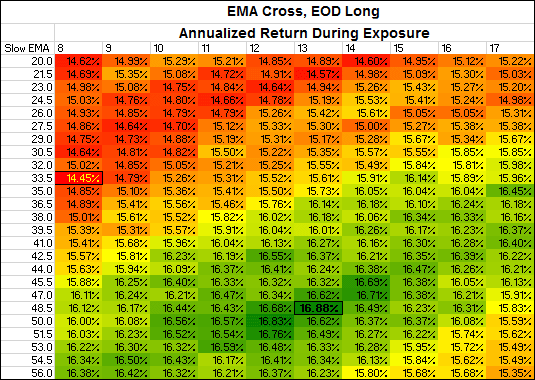
Which moving average crossover signal is the best for trend trading? In my research and backtesting over the past 15 years I have found that the 10-day EMA / 50-day EMA crossover to be the most robust as a profitable mechanical signal for entry and exit on the cross under. This is a great signal to start with to test whether a chart trends historically. In a more extensive backtest another researcher found the 13-day EMA crossing over the 48.5-day EMA to be the best to be more exact.
In longer term trend trading backtests the 200 day moving average strategy was the best key mechanical signal to filter for long term trends across my research of hundreds and hundreds of charts. This is entering as price crosses up and over the 200 day simple moving average and exiting when price crosses down and under the 200 day simple moving average.
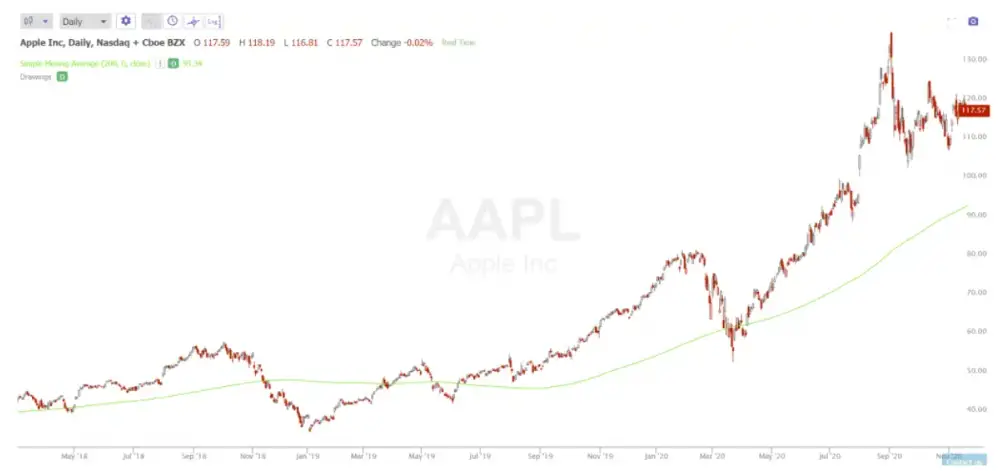
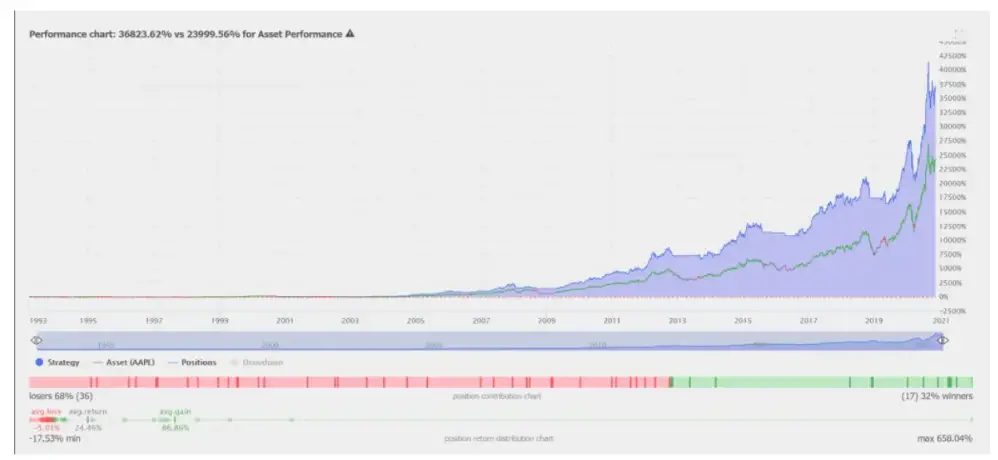
Charts courtesy of TrendSpider.com
Which moving average is best? The one that you can use to create a system that fits your risk tolerance, return goals, and time frame. The best moving average is the one you can use to make money. The best way to make money is to create good risk/reward ratios through stop losses and trailing stops.
