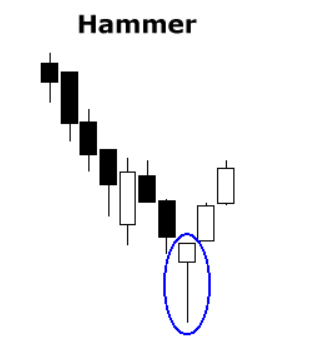
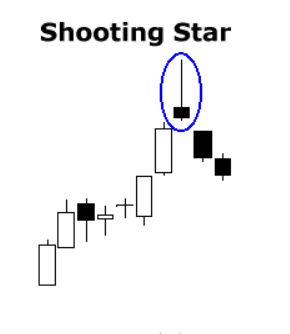
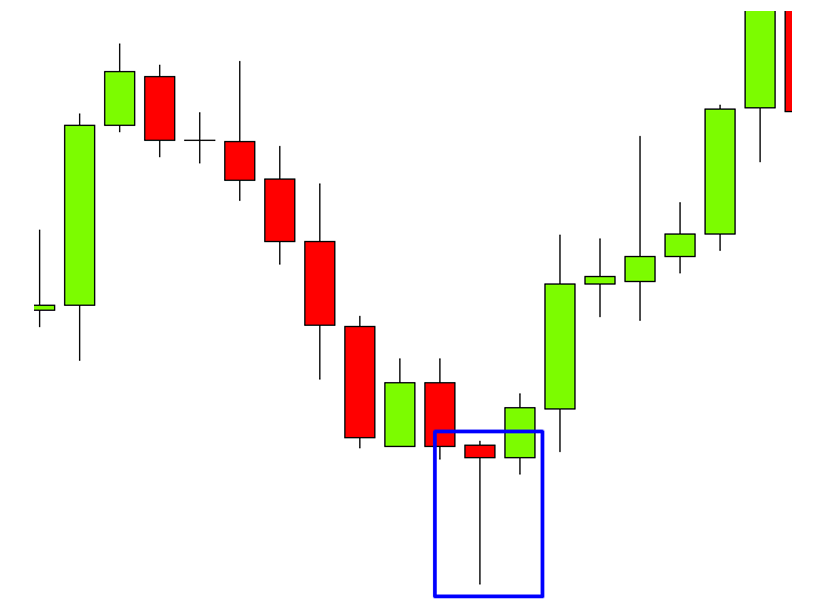
A pin bar candlestick pattern visually shows when price reverses in a time frame back near its starting point. A pin bar candle has a long tail or wick and a small body. The body of a pin bar candle should much smaller than the size of the wick. A good quantified pin bar candle will have a long wick on one side and no wick or a very small wick on the other side.
A pin bar candle can be bullish when it appears at the end of a downtrend as a hammer or a hanging man candle.

A pin bar can be bearish if it comes during an uptrend as a gravestone or shooting star candle.

The pin bar candle is a pattern that price action creates on a chart as buyers or sellers have rejected a key price level. It can be a signal for a coming larger reversal in the current trend itself. Pin bar candles are a visual sign that the chart is losing momentum in a swing or trend.
Pin bars primarily show profit taking on a chart during a trend. The power of their signal must be derived for the size of the wick reversal and inside the context of the chart itself. A bearish pinbar reversal at an overbought reading on a chart in an uptrend or a bullish pinbar reversal at an oversold reading on a chart in an downtrend should be seen has having more probability of working than a random pin bar with no other context.
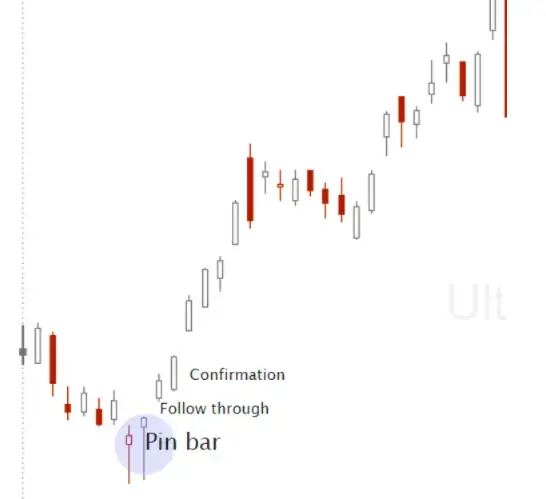
After a strong pin bar forms on chart waiting for the next candle to confirm the direction of the reversal can increase the odds of success. One pinbar shows the potential for a reversal, a second candle in the direction of the reversal increases the probability, a third candle confirms the move is underway.

Chart Courtesy of TrendSpider.com
