Technical analysis indicators derive their readings by applying a formula to a series of price data on a chart. The historical price data used can include samples of the opening price as well as the high and low or closing price over a specified time period. Different technical indicators will use different types of price time frames and others include volume in their calculations. Different types of technical indicators need different price data for their own formula and the time frame used.
A technical indicator can give a trader a different perspective to see the price action from. Moving averages can filter price action to more visibly see trends on a chart for any time frame. MACD can show swings in price action along with current momentum through MACD crossovers. A stochastic oscillator is a momentum indicator comparing closing prices on a chart to a price range over a specified time period. An oscillator is used to measure potential overbought and oversold levels on a chart. Oscillators give a 0-100 reading inside a closed range of possible values. Relative strength index (RSI) can show when price has moved to far and too fast in one direction with 30 oversold and 70 overbought readings.
An oscillator is a technical indicator that moves both above and below a centerline or between set levels as its reading fluctuates in different time frames. Oscillators can show an extreme overbought or oversold reading for long time periods, but are limited in how long they can trend before hitting their maximum reading.
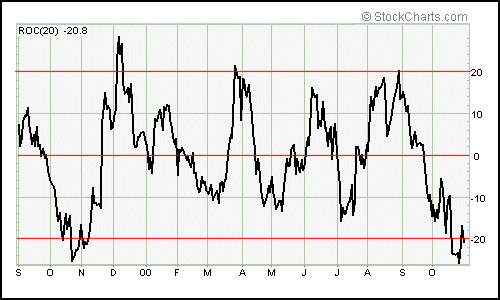
- Rate of Change (ROC) Oscillator
- Relative Strength Index (RSI)

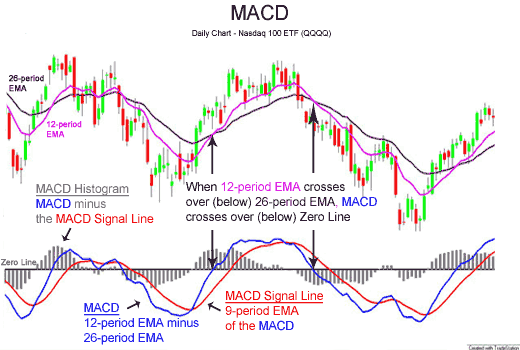
- Moving Average Convergence/Divergence (MACD)
- Stochastic Oscillator
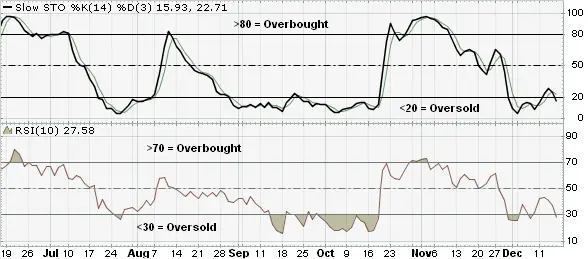
Chart courtesy of StockCharts.com
Technical indicators can be used in trading for three primary things:
- To signal an entry or exit.
- To confirm another signal with a confluence reading.
- To project levels for future profit targets or stop losses.
An indicator can filter price action behavior to show a different perspective of a loss of momentum, volatility change, along with an oversold or overbought chart.
Indicators can also show a divergence between a new breakout and momentum. A technical indicator can also show that a breakout to new highs could be happening when a chart is already overbought. This decreases the odds of it evolving into a new trend higher as price has already gone too far, too fast. A breakout to all time highs on a chart with a 70 RSI reading may not have the same upside profit potential as a breakout closer to the 50 RSI.
- Moving averages can be used to create trend trading systems.
- Technical resistance breakout of price action that happens at the same time as a bullish MACD crossover confirms the momentum.
- RSI oversold and overbought readings can be used as profit targets. Short side profit targets could aim for the 30 RSI and long side profits could aim for the 70 RSI.
Leading indicators can give signals showing momentum before price movements happens. There must be some form of momentum before a trend occurs, higher highs and higher lows, a breakout of a price range, or a big volatility expansion to the upside. Leading indicators try to show this momentum at the beginning of a trend.
Most leading indicators are different types of momentum oscillators.
Types of leading indicators are the Commodity Channel Index (CCI), Relative Strength Index (RSI), Stochastic Oscillator, and the Williams %R. These indicators are not predictive, they simply show momentum which increases the odds of the path of least resistance continuing in the direction of their signal. Leading indicators can get you into a swing or trend in price early for a bigger win but they can also be wrong and be premature in their signal generation. They generally signal momentum and keep traders on the right side of a short term move.
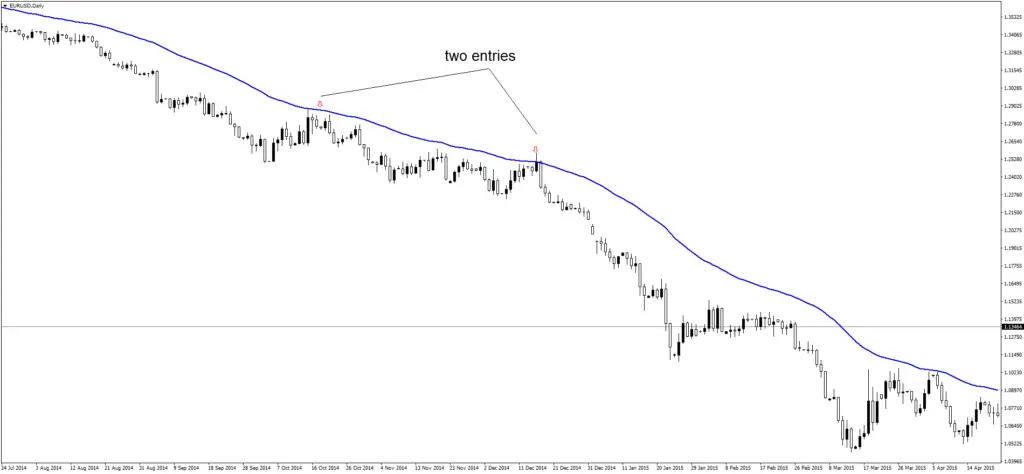
Lagging indicators are slower to react to changes in price action and are popular with longer term trend traders. The most popular lagging trend trading indicators are moving averages and the MACD (moving average convergence divergence).
- Moving averages
- MACD
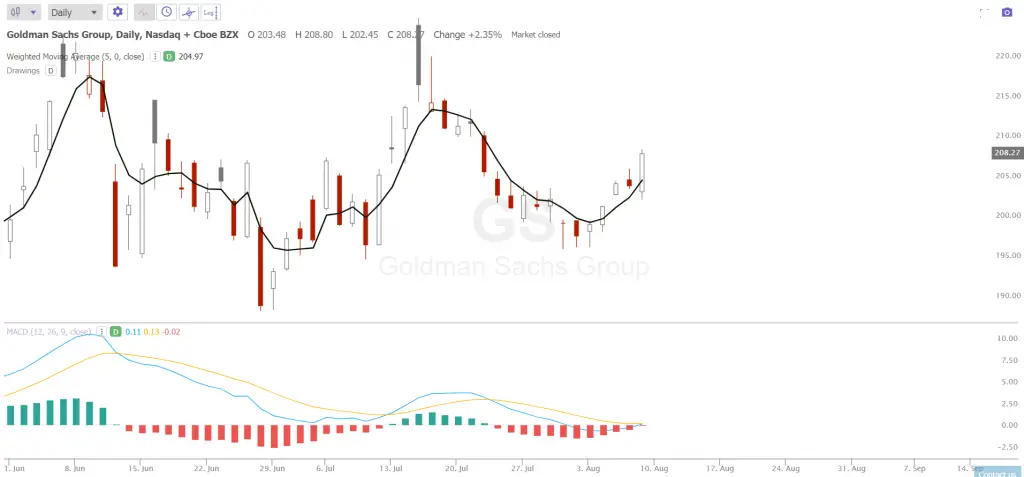
These indicators generally only signal a trend after it has started. These lagging indicators are best used on charts that develop into strong trends that give you more time to get in and out without missing the move.
These slower indicators are designed to get trend traders in and keep them in a chart as long as the trend continues. These more lagging indicators are not useful trading range bound sideways charts. These trend trading indicators can cause many false signals when price goes in one direction then whipsaws or signals a trend then falls back into a trading range. These trend indicators can be very profitable in the long term when used to create small losses or big wins. The big wins in the trends can make a lot more money than is lost in the choppy false signals over the long term.
A divergence can be an important signal for oscillators. Divergences can be a strong warning sign that the momentum of a trend is waning and could reverse, signaling for a trader to short a market top or buy a market bottom as the trend is about to bend. There are both positive and negative divergences on charts. A negative divergence signal happens if an indicator goes lower when the price on a chart goes higher. A positive divergence signals if the indicator goes higher when the price on a chart goes lower.
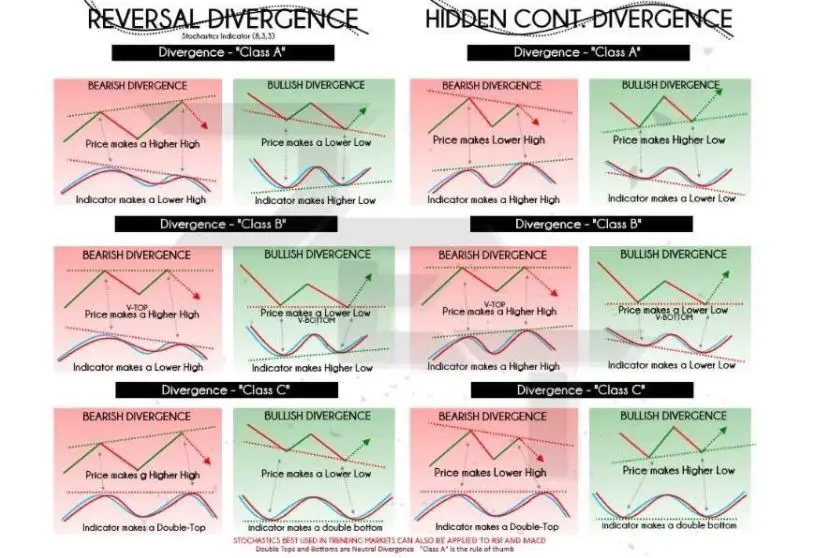
Technical indicators alone are not trading systems they are signals. Technical indicators can be used in the process of creating quantified entry and exit signals for a trader’s watchlist. Technical indicators are not predictive as much as they are ways to quantify good risk/reward ratios and keep a trader on the right side of momentum and trends.
