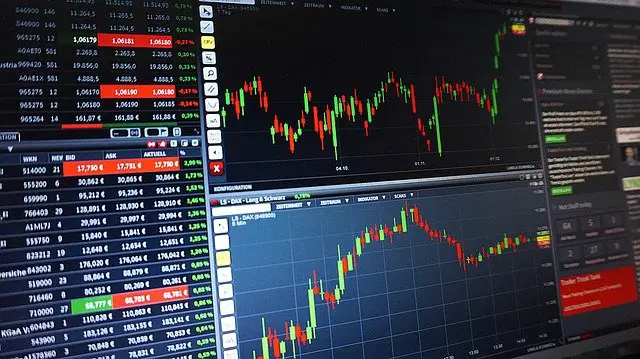
Reading price action is the art and science of trading by understanding the interaction of buyers and sellers as measured by prices on a chart. Many pure price action traders remove all technical indicators from their charts and trade price alone. Some consider price action trading the purest form of technical trading and technical indicators as just derivatives of price. Many traders prefer to use price action alone for their trading decisions.
Reading the price action on a chart can allow a trader to see several things.
- Key price levels of price support.
- Key price levels of price resistance.
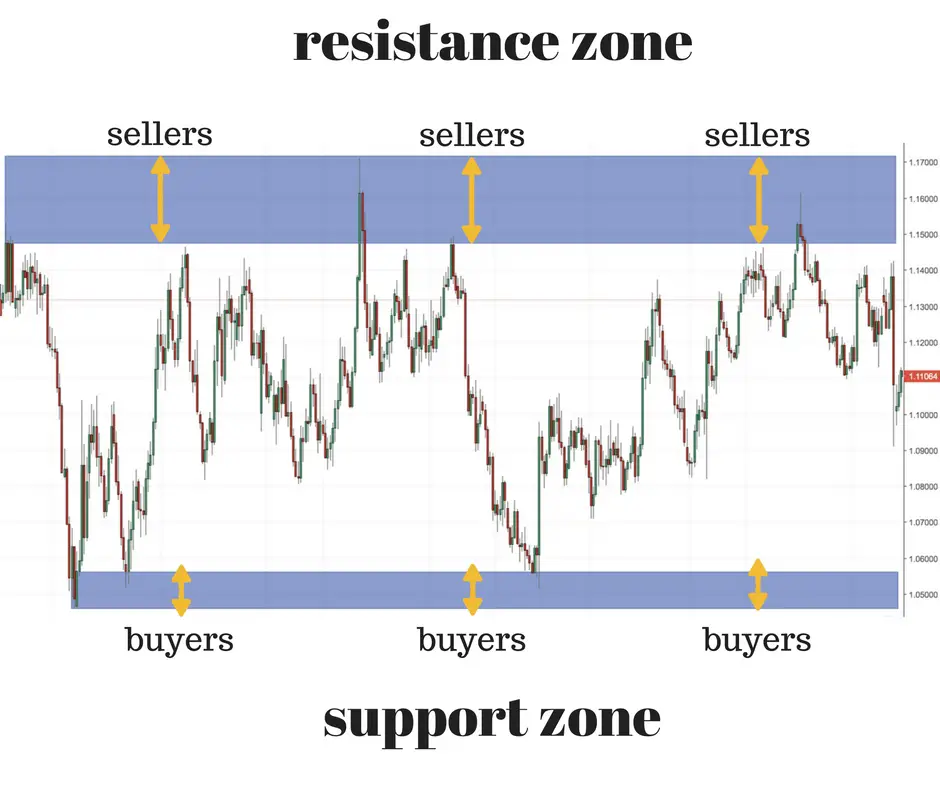
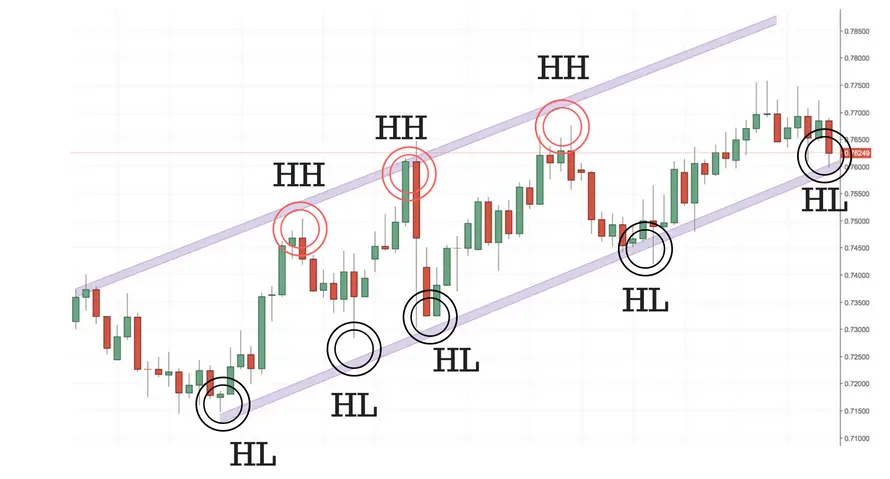
- Higher highs and higher lows defining an uptrend.
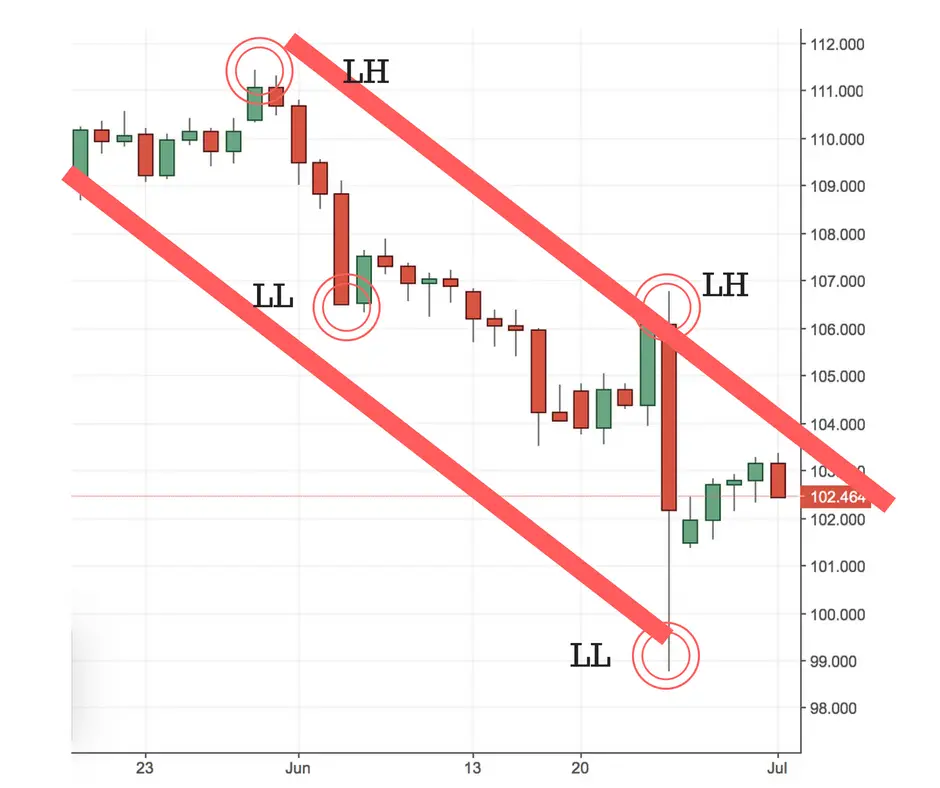
- Lower highs and lower lows defining a downtrend.
Trend lines are used to define the vertical and horizontal support and resistance areas for price action on a chart. Many chart patterns are built by looking at price action and defining a breakout from these zones.

Chart patterns can signal breakouts, reversals, and continuations by reading price action support and resistance zones.
Price action can be read on charts from all time frames from minute charts for day trading to monthly charts for long term position traders. Some scalpers and day traders read price action on level 2 quotes to see the direct interaction between bid and ask prices in real time.
Many trend followers create reactive trading systems from price action alone. An example could be buying a new 20 day high in price and selling it when price makes a new 10 day low in price looking to create big wins and small losses.
The legendary Turtle traders used a price action system.
- The Turtles traded a breakout system. System 1 entered a 20 day breakout and exited at a 10 day breakout in the opposite direction of the entry.
- System 2 entered a 55 day breakout and exited at 20 day breakout in the opposite direction of the entry.
- No trade could incur more than a 2% equity risk, stop losses were planned accordingly.
Legendary trader Nicolas Darvas was one of the first to read price action to make millions trading uptrends. Darvas’ system would look for stocks making new all time highs on increasing volume. He would quantify trading ranges of price support and resistance highs to draw a box around. A breakout above the high prices would signal for him a new buy entry point and a breakdown below the low in a Darvas box price would trigger a stop loss and signal for him to exit the trade. His Darvas Box strategy told him to hold his position as long as price didn’t drop and stay back in the previous price range box. A price breakout would signal a new possible support level are to watch for the next box if price stair stepped upwards. Nicolas Darvas was a pure price action trader and used no technical indicators, just price alone.
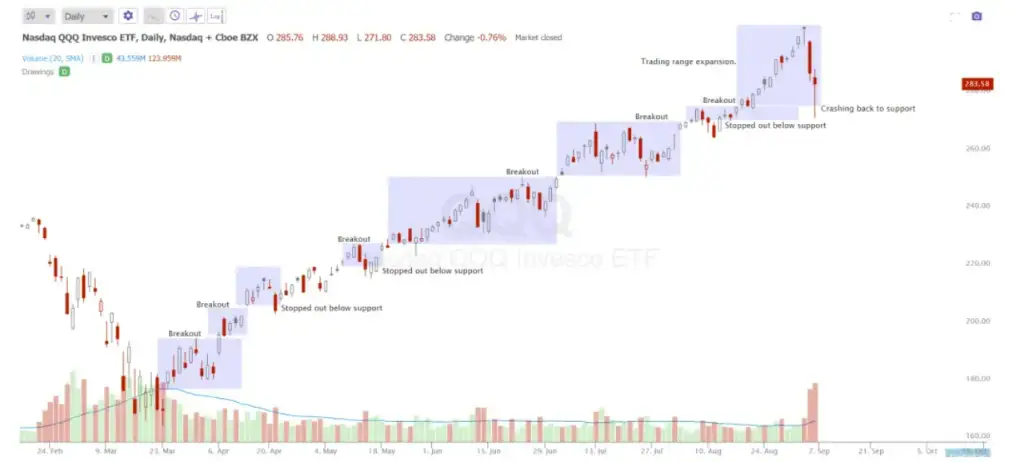
Many legendary traders used pure price action trading systems at times to simply follow to path of least resistance of buyers and sellers.
