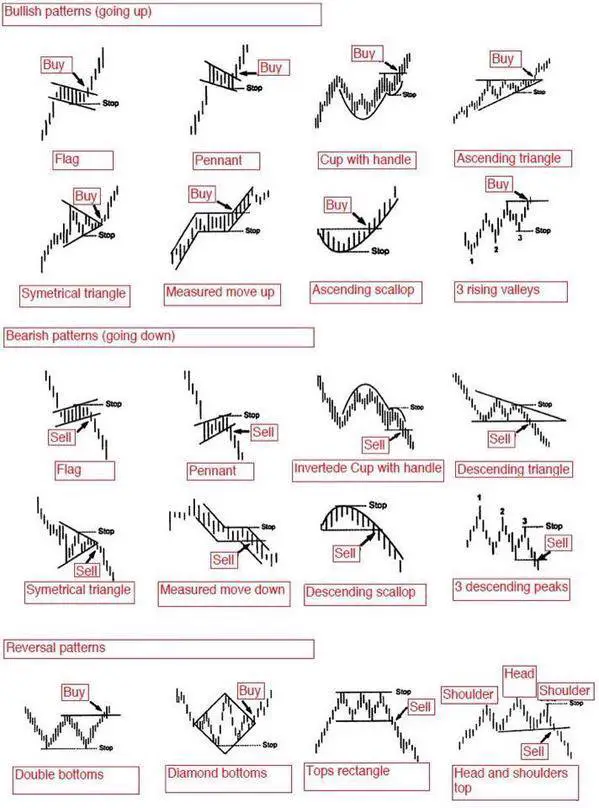
 Price action trading creates chart patterns in the financial markets through the buying and selling of positions by traders and investors. A chart pattern is a visual record of the votes by bears and bulls around different price levels.
There are different types of chart patterns. Continuation chart patterns that confirm a trend is going to continue in the current direction and also reversal patterns that signal a trend is likely to reverse.
Chart patterns can be considered in a bullish trend when there are higher highs and higher lows or bearish trend when there are lower highs and lower lows being made on the chart. A chart defines the path of least resistance in a market.
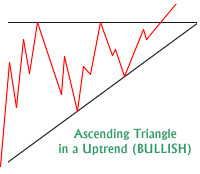
A bullish flag is a range that develops in an uptrend with a slight downward slant. This pattern is confirmed when the resistance in the range is broken to the upside. A bear flag would be the opposite forming in a downtrend with a confirmation of a break through the price range support.
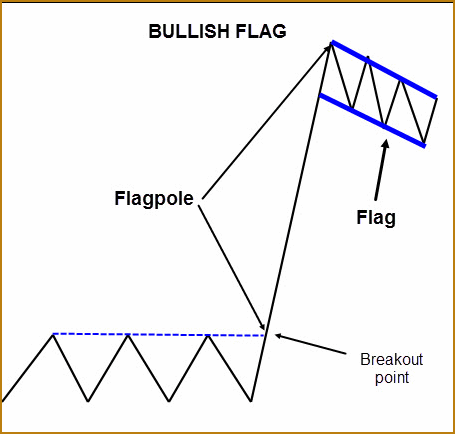
A descending triangle chart pattern sets lower highs and a vertical support after a downtrend. A confirmation of a continuation to the downside is a break below support.
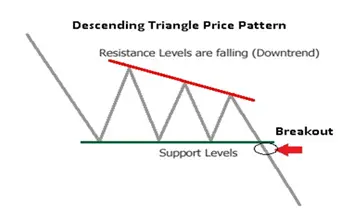
An ascending triangle chart pattern sets higher lows and has a vertical resistance and forms after an uptrend. A confirmation of a continuation to the upside is a break above resistance.
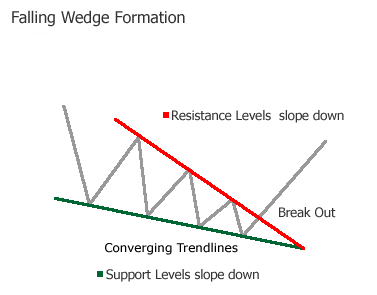
The falling wedge chart pattern can be considered in the continuation or reversal category. A wedge chart pattern is created by two converging trend lines, and shows price range contraction. The highs and lows of prices tend to be either rising or falling at different inclines. A wedge pattern can signal a trend reversal as the current trend is becoming weaker.
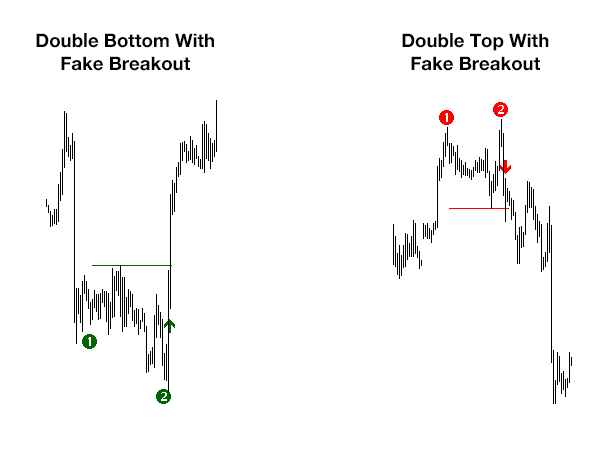
Double top or double bottoms are reversal patterns that signal when a market trend could be ending. These patterns are created when a key price resistance level in an uptrend or price support level in a downtrend on a chart is tested twice but fails to breakout. A pullback after the two attempts to breakout through previous high or low prices is the first signal that the trend could be reversing in the other direction.
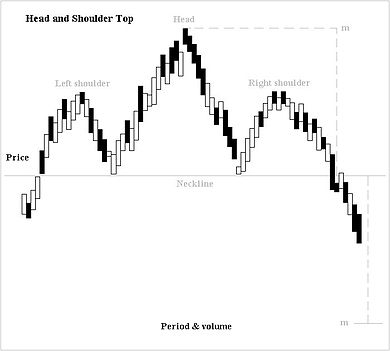
The head and shoulders chart pattern is one of the most popular bearish setups in technical analysis. It shows three attempts to make new highs and then trend but fail, it precedes many major corrections and bear markets.
A chart pattern is not a trading system just like a map is not a journey. It is the management of your trip that determines whether it will be good or bad. Chart patterns are best used for creating good risk/reward ratios for trades by setting a stop loss and also letting winners run. Chart patterns show the path of least resistance they are not crystal balls that predict the future.