Here is a list of the seven most popular reversal candlestick patterns used in technical analysis to determine a high probability area on a chart for a reversal of a current trend. These patterns show a shifting in power from buyers to sellers or sellers to buyers through the price action of the candle being unable to make higher highs or lower lows.
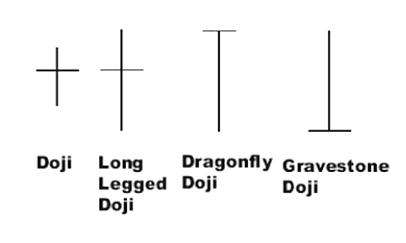
The doji candlestick chart pattern is usually formed from a small trading range in a time period where both the open and closing price are nearly equal. A doji candlestick usually signals indecision for a direction in a chart. A doji candle can signal a pause in the current trend and a higher probability that the trend is about to end or go sideways. A dragonfly doji can signal the end of a downtrend and a gravestone doji can signal the end of an uptrend.
Vistula / CC0
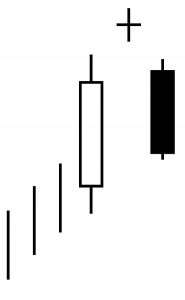
The abandoned baby is three-candle reversal pattern in uptrend or downtrend. In an uptrend it can help define a top and in a downtrend help define a bottom. The first candle moves strongly in the direction of the current trend, the middle candle is smaller and gaps away from the first candle, the final third candle is a big gap reversal candle back to the first candle.

Wikipedia
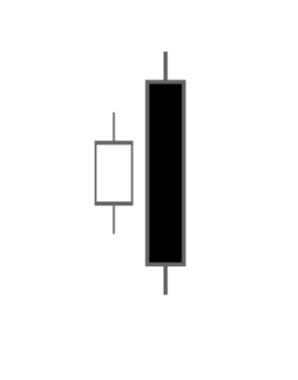
An engulfing candlestick pattern is two-candles in a row that can signal a reversal of the current trend on a chart. The second candle range completely engulfs the trading range of the first candle showing a failure to go higher in an uptrend or lower in a downtrend.
Altafqadir at English Wikipedia / CC BY (https://creativecommons.org/licenses/by/3.0)
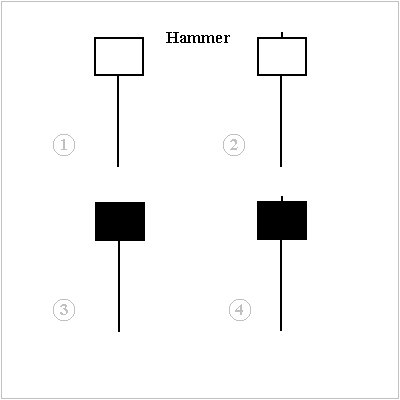
The hammer candle can signal a bottoming pattern during a downtrend as new lows are rejected and price closes much higher than the intra-day lows. A hammer candle has a small body, little or no upper wick, and a long lower wick that makes a new price low but then reverses strongly.
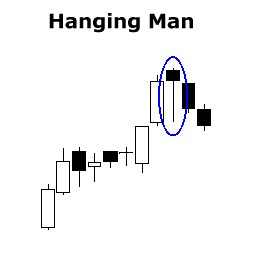
A hanging man is a bearish reversal candlestick pattern. When a hanging man candle happens inside an uptrend of higher highs and higher lows it can signal the high probability of a reversal or sideways action following. Some people use the hanging man as a signal in itself but the probabilities of success are better if it happens at the same time as other technical indicators like previous price resistance or an overbought reading on the chart.
Wikipedia
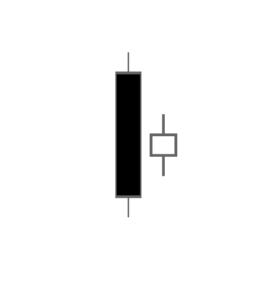
A harami two-candle pattern signals prices could begin to stop trending in the previous direction, which could lead to a trading range first before a big reversal in the opposite direction. A harami pattern has a higher probability of success if a chart is also overbought or oversold when the pattern occurs.
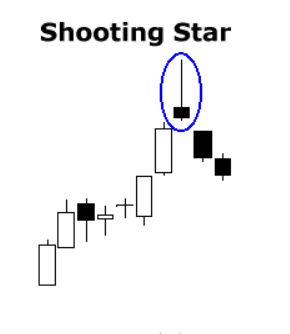
Chart Courtesy of StockCharts.com
A shooting star candle usually happens during a strong uptrend when a market opens and then goes strongly higher intra-day but reverses and closes lower than the intraday highs near the opening price or below. The larger the upper wick is relation to the candle body the more bearish it is as it has created new overhead resistance and shows a rejection by buyers at these higher prices. A shooting star is a one of the most bearish candlestick patterns and could signal the end of an uptrend and a high probability of a downtrend beginning.
These are the key candlestick patterns to keep in mind when looking to identify when a trend is bending or ending on a chart.