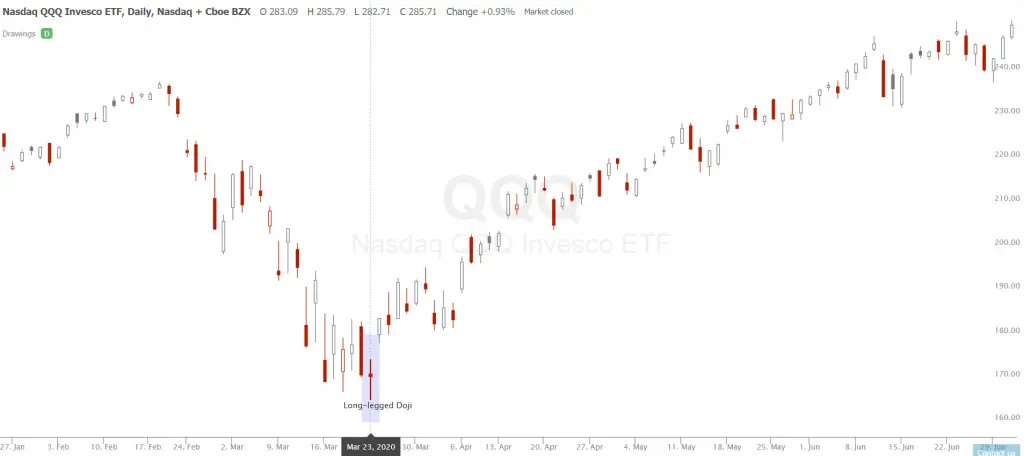
What is a long-legged doji candlestick pattern?
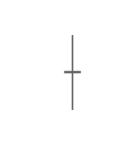
The long-legged doji candlestick pattern has both long upper and lower shadows (wicks) and generally has a closing price near where it opened in the time frame of the candle. The long-legged doji candlestick can signal extreme indecision in the current market with a large trading range but no winner between buyer and sellers to move price in one direction.

Long-legged Doji image via Wikipedia
This indecision candle can be seen by investors as a signal that there is a high probability of an end to the current trend as traders and investors were unable to keep the price moving in one direction.
In an uptrending market a long-legged doji can warn of an impending reversal to the downside. In a downtrending market a long-legged doji can signal a potential reversal to the upside.
Long-legged doji candles can also signal the end of a trend but the beginning of a sideways range bound market as neither buyers or sellers can get the upper hand in bidding a market up or down. (Buyers and sellers are always equal in trading action it is the price that changes and moves based on current bid/ask spreads agreeing to make a trade).
- Long-legged doji have very long upper and lower wicks and a tiny body with the opening and closing price almost the same.
- This candle pattern signals indecision.
- It can be a reversal signal during strong trends.
- It can also signal a new range bound market.
- Many traders will wait for the next candle on the chart after the long-legged doji to confirm a reversal as it creates a higher probability of success than signaling off just one candle.
- It does not always work and can just be a news driven volatility expansion before the existing trend resumes.
- The odds of it being a reversal signal are higher when the long-legged doji candle occurs in an uptrend near an overbought reading or it appears in a downtrend near and oversold reading.

