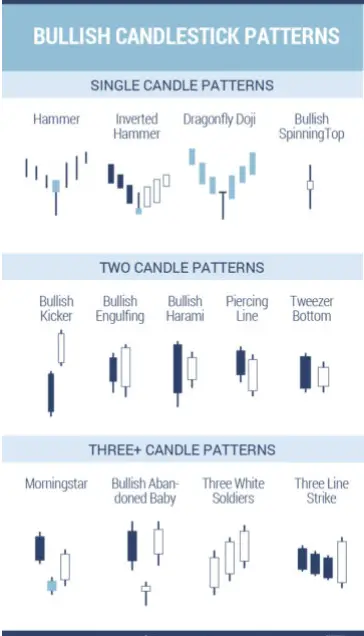
Bullish candlestick patterns on a chart visually show buying pressure. These patterns can show the possibility of a price reversal during a downtrend or the continuation of an uptrend already in place. There can be single bullish candles or bullish candlestick patterns containing multiple candles in row.
Here are some of the most popular bullish candlestick patterns:
- Hammer
- Inverted Hammer
- Dragonfly Doji
- Bullish Spinning Top
- Bullish Kicker
- Bullish Engulfing
- Bullish Harami
- Piercing Line
- Tweezer Bottom
- Morning Star
- Bullish Abandoned Baby
- Three White Soldiers

Bullish candlestick patterns visually show the success of buyers to take a price higher and buying take control of a chart for the timeframe of the price action. These are bullish signals that need confirmation with an upswing in price after the pattern forms.
The meaning and value of bullish candlesticks must be considered taking into the context of a chart pattern and their confluence with other signals. A bullish candlestick pattern that happens when a chart is oversold could signal a reversal of a downtrend. Bullish candles that happen late in an uptrend after a long term run in price after a chart is already overbought can have a lower probability of success.
Bullish candlestick patterns that have a confluence with other systematic buying signals increase the odds of a trades success.