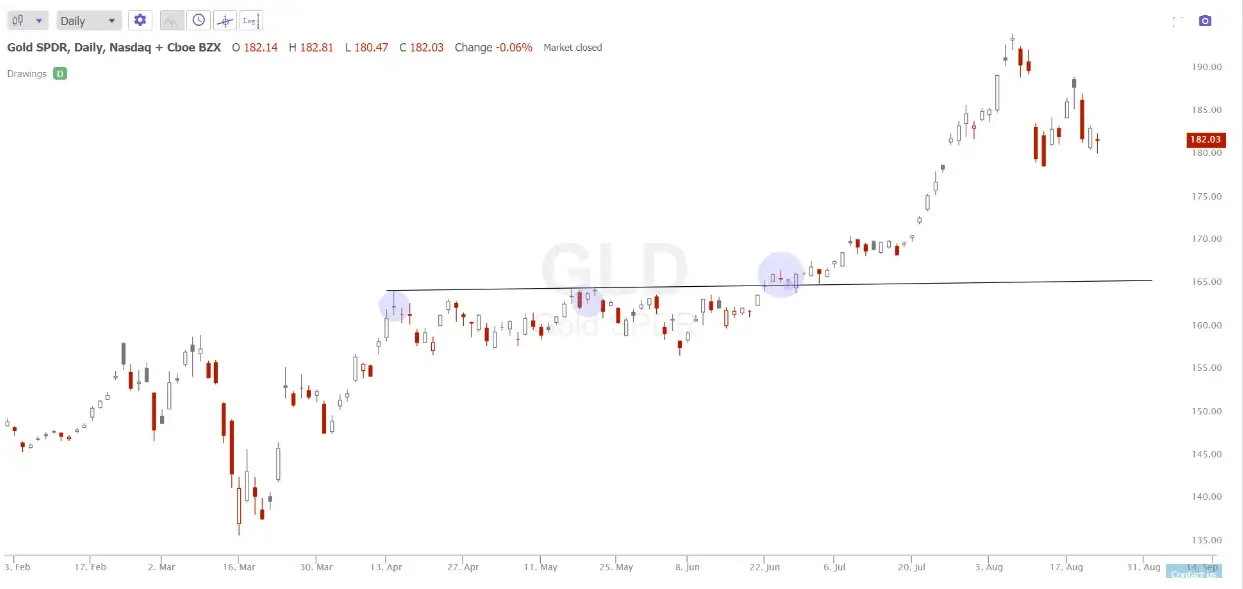
The flat top breakout chart pattern gets its name from the top of the chart being flat as sellers and buyers have met and agreed at the key resistance level. Once trades take place above that flat upper resistance level it is considered a breakout above that level.
Flat top breakout trading is used by many momentum traders and trend followers to enter a long position on a market that has broken above resistance on a long-term chart. Some day traders also use a flat top breakout on the intraday chart to trade the quick momentum that can happen after price reaches a high on the day.
A flat top breakout can look similar to a flat base pattern but the difference is the flat top happens at the highs of resistance while a flat base can happen inside a long-term trading range and not press new highs.
The flat top breakout pattern on top growth stocks can see big movements to the upside after being broken. With this type of a breakout buyers and sellers have been working through supply in the trading range and as they run out of shares to trade under the resistance highs shares will make higher prices above that old level.
A breakout to new all time highs in price can have a lot of momentum and begin a new trend. In this pattern the old resistance can become the new support on pullbacks as people who missed the first breakout will buy that price again with a second chance. When all holders have a profit at the highs there tends to be less selling pressure and price can begin to move higher.
Trend followers and momentum traders like to stay on the right side of the trend and this type of a breakout on a daily chart is a signal for the direction of the next move. Day traders just want a quick price movement in one direction for profits and a break out can be the beginning of a move in that direction for the remainder of the day.

Chart courtesy of TrendSpider.com
The flat top pattern is first a long and narrow trading range pattern like the $GLD chart above. Price action stayed in a consolidation range from approximately $165 to $157 for about two months. This was the range and the flat top resistance was in the $165 price zone that was tested many times and not broken keeping the resistance at the top flat. As price finally closed above $165 the chart became a flat top breakout.
The range in this pattern can be rectangular shaped or have irregular support levels and both formations are valid as long as the top of the pattern at resistance is flat. The buy signal is on the breakout. Profit targets can be set at round numbers, an overbought reading, or a trailing stop can be used to maximize profits.
This pattern can have a long price range consolidation period and needs a minimum of three tests of the resistance area to be called a flat top pattern. Whenever price finally moves above the resistance and stays there whether intraday or with a gap up at the open this signals the flat top breakout.
The trigger of the price breakout can be news, an earnings announcement, or a business catalyst that finally pushes the buyers to overcome the sellers and make new highs over the old resistance. The pattern can run in one direction as there is no pressure from trailing stops being triggered by holders only profit targets signaling traders to exit.
The flat top breakout pattern signal is more valid and has the potential for a bigger trend to emerge the longer the consolidation and time frames. The pattern shows the path of least resistance for the future trend.
