What is market breadth?
Market breadth describes the amount of stocks that are participating in the trend of a stock market index or exchange. If a stock index is going higher but over half the stocks in that index going lower, this is called negative market breadth and hidden bearish divergence. When a few stocks have such huge gains individually that they push the whole stock index higher it is more risky to be bullish on the index because if those stocks reverse the whole index can fall by a large percentage quickly.
A healthy stock index has the majority of stocks in it rising together showing equities as an asset class are under accumulation. More stocks going up than going down shows positive market breadth for the index. A healthy bull market has the majority of its stock prices rising with the rise in the index.
Market breadth technical indicators quantify the amount of stocks going up compared to ones that are going down in a specific index or a stock exchange. Positive market breadth happens if more stocks are advancing than are declining and is an indication that bullish traders and investors are leading the stock market’s trend. Good market breadth confirms an uptrend in an index and is supported by a majority of stocks. The opposite is also true, a negative market breadth showing a greater amount of declining stocks is used to quantify and signal a potential bearish downtrend move in a stock index or exchange.
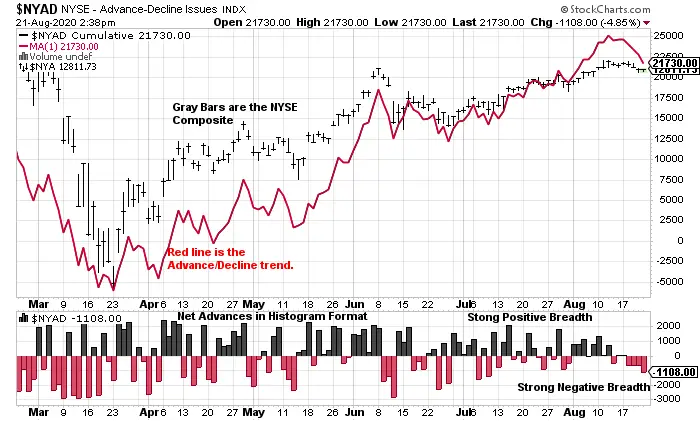
The Advance-Decline Line is a technical indicator for market breadth that quantifies the the number of advancing stocks minus the number of declining stocks which is the net advances. Net advances have a positive reading when the number of advances are more than the number of declines and it is negative when the number of declines are more than the advances. The AD line is a cumulative quantification of net advances, going up when positive and dropping when negative. Technical analysts use net advances to put the AD line on a chart of a stock index and see it’s trend in contrast to the move of the index price. The AD line needs to be moving in the same direction as the index being tracked to verify an advance or a decline. Any bullish or bearish divergences in the AD line signal versus the trend of the index that choses a variance that stock advances or declines are not the same as the index advance or decline could show the probability of a trend reversal.

Chart Courtesy of StockCharts.com