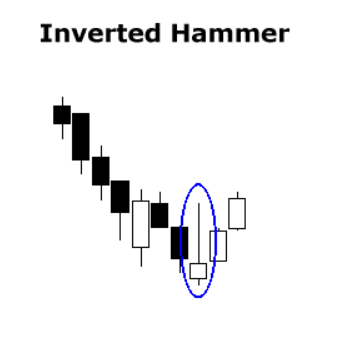
The inverted hammer pattern is a type of candlestick located at the end of downtrend and is used by technical analysts as a bullish reversal signal from the lows. The inverted hammer candle visually looks like a hammer turned upside down with its handle pointing up. It is defined as a one day bullish reversal pattern.
During a downtrend an inverted hammer price opens lower than the previous periods low. Then price trades higher creating a large candle wick inside the period being tracked and falls from the highs but still closes above the open, it finishes trading looking like an square upside down hammer.

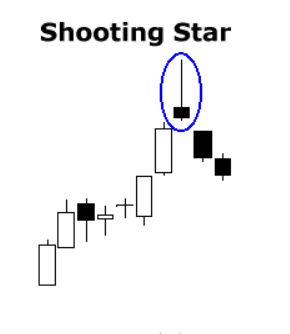
When the inverted hammer is formed during an uptrend in price it is called a shooting star this pattern forms in an uptrend and signals a high probability for a market top.

The inverted hammer pattern is quantified as a candle with a small lower body along with a long upper wick (or shadow) which is also a minimum of two times the size of the small lower body. The candle body must be at the lower end of the price trading range and there should be a tiny or better yet, no lower wick (or shadow) on the bottom of the candle.
The large upper wick (shadow) of the candle shows that the buyers pushed prices up during the trading period of the candle’s formation but were met with selling at higher price levels which pushed the price back lower to closer to the open than the intra-day or period highs. Many traders wait and look for a higher open and close on the next candle of the timeframe to verify the validity of the bullish inverted hammer candle and increase the odds of success in buying the reversal from the lows.
With the inverted candle the context of its appearance is crucial as it can signal bearishness in an uptrend and bullishness in a downtrend. Even though they look the same commonly the pattern thought of as the inverted hammer is the bullish one that appears during downtrends while the bearish one is usually referred to as the shooting star.