Is there a simple moving average monthly trading strategy that crushes buy and hold investing?
Buy and hold investing on the S&P 500 index with an exchange traded fund or a low cost mutual fund is a top performing system that few money managers and traders can beat. This is a good core strategy for a trader or investor to start with and then find an edge to help beat it.
The downside of buy and hold investing is the pain that has to be endured during bear market drawdowns and market crashes, finding a way to decrease the drawdowns in capital could also help increase the returns. With buy and hold when you buy and how you accumulate your position over time along and when you need the money and have to sell affect your returns. All investing strategies have an element of timing.
Supporters of buy and hold and money managers like to use the market bottom of March of 2003 or March of 2009 as the beginning for projecting returns. A buy and hold investor that started in March 2000 or January 2008 with a large position will not think it is the Holy Grail of investing for many years after their entry. There are historical quantified signals that can improve returns over just buying and hoping.
Here is a simple moving average strategy that beats buy and hold investing over the past 20 years using the principles of trend following. On the last day of each month you take one of the actions:
- On the last day of the month if you are long the SPY ETF and price is going to close over the 200-day simple moving average you stay long.
- On the last day of the month if you are long the SPY ETF and price is going to close under the 200-day simple moving average you sell your position and go to cash.
- On the last day of the month if you in a cash position and price is going to close over the 200-day simple moving average you buy the SPY ETF and go long.
- On the last day of the month if you in a cash position and price is going to close under the 200-day simple moving average you stay in cash.
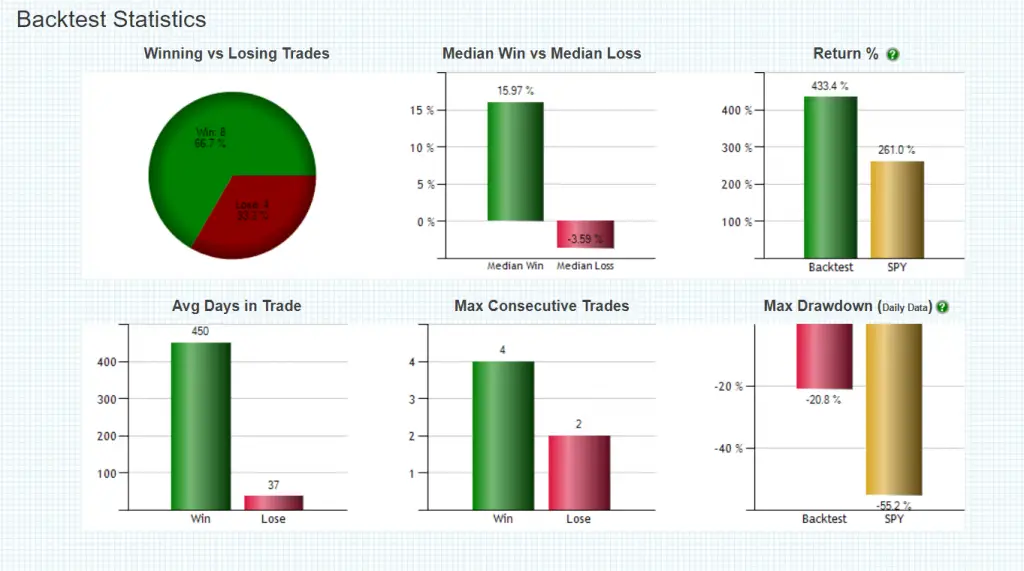
It is not complex and only takes one action on the last day of the month for buy and sell signals. It beats the returns in holding the S&P 500 index by triple digits and cuts the drawdown of capital almost one third.
Unlike mutual funds and hedge funds, a good systematic moving average strategy used consistently can beat the S&P 500 index over time by staying long during bull markets and going to cash during bear markets. With this type of strategy investors are acting like buy and hold investors during bull market uptrends but staying in a cash position when investors are taking their drawdowns in capital during bear markets and crashes.
This is not the Holy Grail of trend trading the SPY ETF, it is just math. The 2oo day SMA is eventually lost during bear markets and crashes and price stays above the 200 day SMA during bull markets. The end of month signal avoids all the intra-month false signals when price chops under and over this line. For a swing trader or position trader the signals will seem like a longtime frame but for a buy and hold investor this will seem like an active short term strategy.
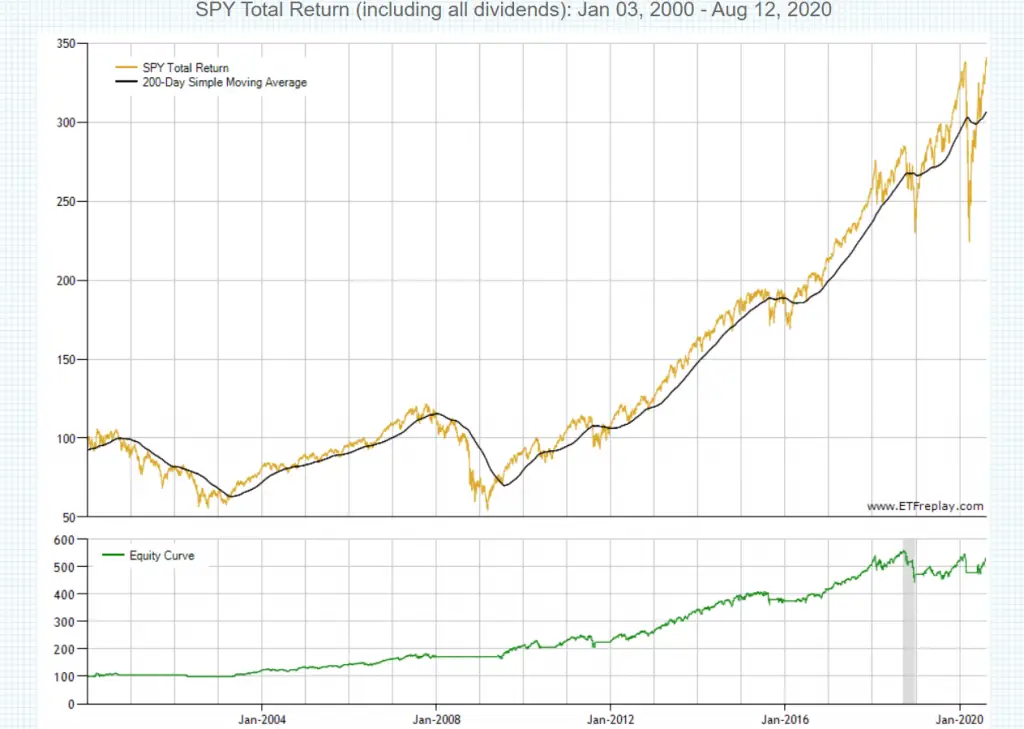
The 200 day simple moving average of prices is one of the most popular stock market signals and backtesting shows since the year 2000 it has worked as an end of month signal.
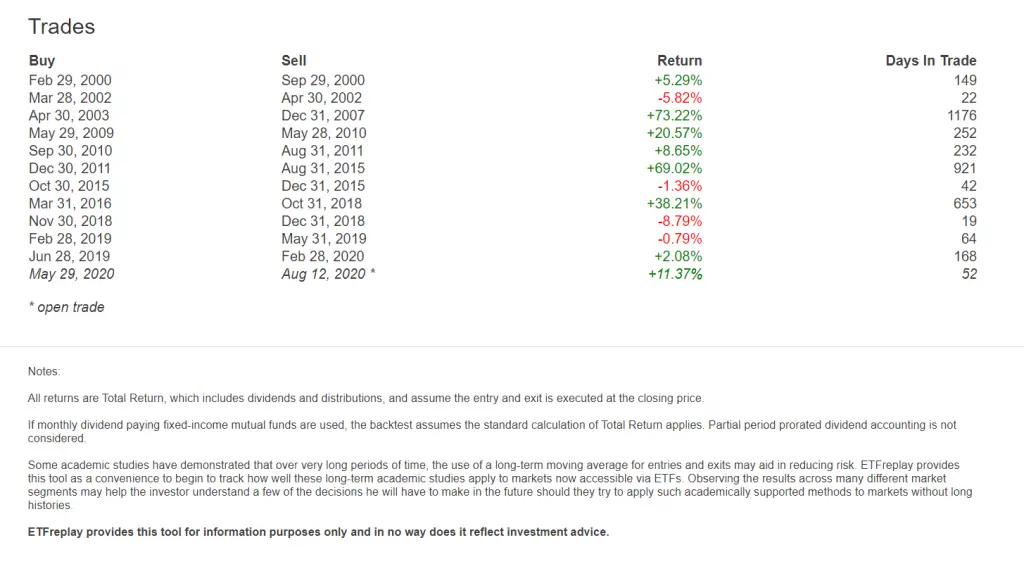
The trading signals for this system had 12 entries and 11 exits and is currently long as of the day of the backtest data. The signals avoided all three of the major bear markets of the past 20 years but captured almost all the bull market profits.


This is not investment advice just as an example to get readers thinking about alternatives to buy and hold investing. Everyone has to find a strategy that fits their own timeframe, risk tolerance, and return goals.