How do you identify supply and demand zones on a chart?
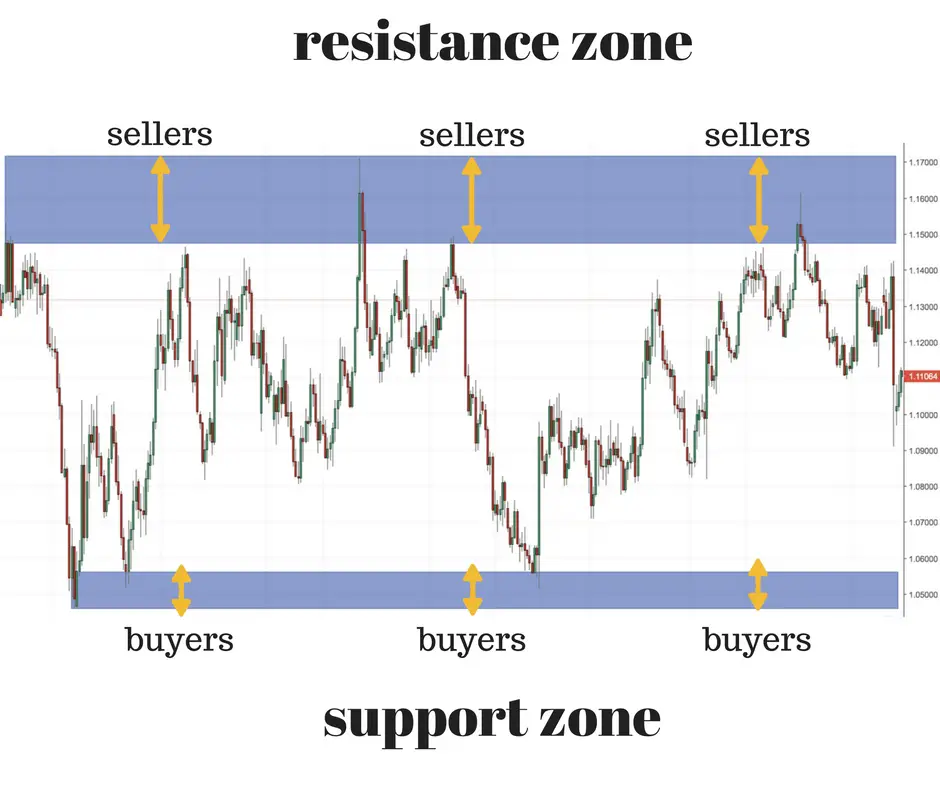
Areas of supply for a market is at overhead price levels is what creates resistance. An area of supply is a price zone where many traders and investors are holding a stock and willing to sell it. Overhead resistance is created when people sell to lock in their gains at profit target levels. A supply level can also be created when people just want to get back to even after being in a loss that finally rallied back to where they bought it. Supply is the inventory people are holding for a market at a price level and they want to unload it when given the opportunity.
Areas of demand for a market can be at lower price levels that creates support. An area of demand is a price zone where many traders and investors are wanting to buy a market when price gets back to that level. Lower price levels of support are created when people have been waiting to buy a market at a lower price when it gets back there. This could be an old area of a low price, an overbought reading on a chart, or a key moving average support. Demand is the area of support where buy orders are set because people believe it is an opportunity to get a market at a value price with a good risk/reward ratio on entry.

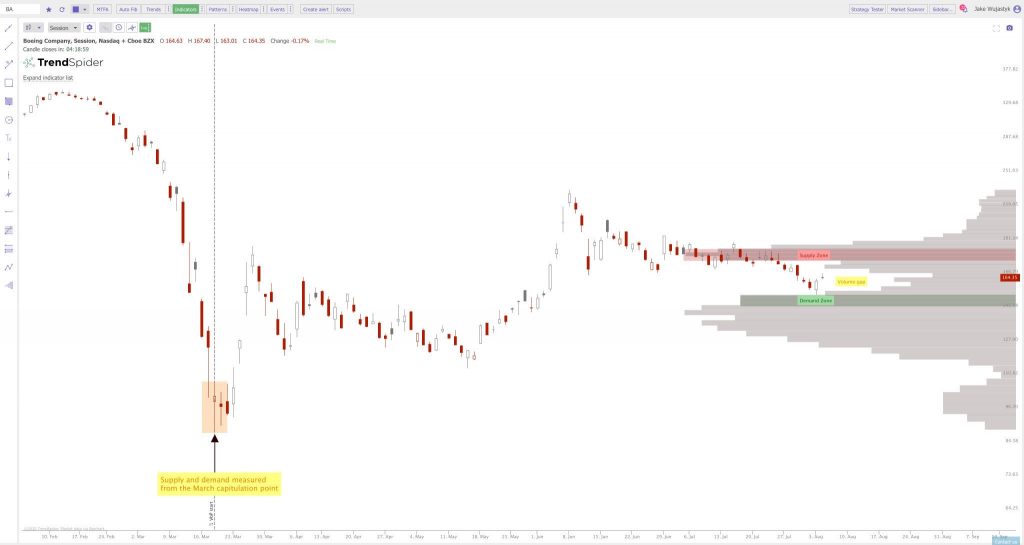
There can be a correlation with volume and support and resistance zones. The price that markets trade at can create the areas of interest that traders and investors are making transactions.
A price zone where there was a large volume of buyers trying to get into a breakout that fails can create a lot of buyers that become trapped at higher prices in a market that is falling. These trapped buyers can create a future supply and resistance zone as they are happy to exit to get out at even when given another chance.
An old support area that had high demand in volume can create a price zone where a lot of stop losses are set. A lot of volume at an old area of support can set the stage for a breakout to the downside later if the key support area is lost later with no demand from new buyers.

To summarize:
Look for price zones of meaning that set the highest highs or the lowest lows on a chart over a period time without being broken to the upside or the downside.
A supply zone is a price level where current holders of a market are located and are willing sellers when price reaches that area.
A demand zone is a price level where traders and investors on the sidelines are willing to step in and buy when prices get that low.
These are the principles in technical analysis that creates horizontal resistance and support lines on charts.