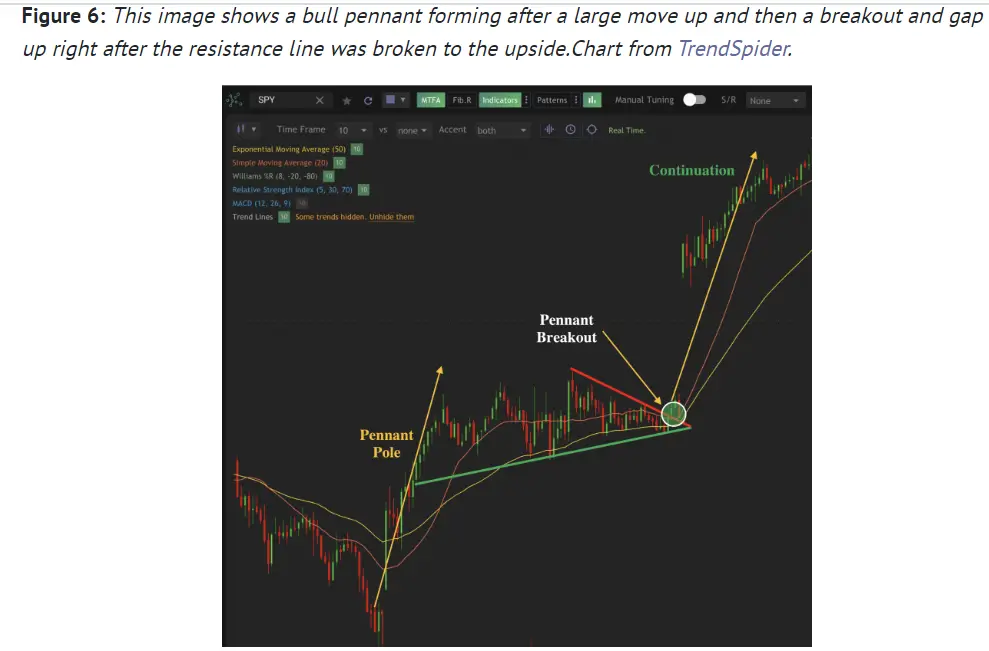
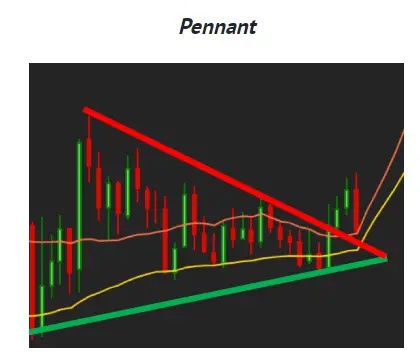
A bullish pennant chart pattern can be a powerful bullish chart pattern that is found during strong bull markets that is very similar to the bull flag. They are more rare than a bull flag. The price compression in the pennant can lead to explosive moves once there is a breakout. Many times these patterns are formed in leading growth stocks that have gone parabolic.
- The bull pennant is a continuation pattern of the previous uptrend.
- A pennant pattern is very similar to a flag pattern except a flag is rectangular and descending and a pennant is triangular.
- A bull pennant chart pattern occurs after an uptrend out of a previous price base.
- The ‘pole’ is represented by the previous uptrend in price before the consolidation.
- The symmetrical triangle of the pennant must have overall lower highs and higher lows that run parallel and converge toward each other.
- The pennant is generally neutral in direction.
- The signal of the end of the pennant pattern and the beginning of a new potential up trend is when the descending upper trend line is broken with a move upwards in price.
- This pattern is thought to be the consolidation of the uptrend.
- Traditionally the move out of the pennant is thought to be potentially as big in magnitude as the uptrend before the pennant begins.
- A breakout of the pennant with higher than normal volume increases the chance of a continuation of the uptrend.
- A stop loss can be set at the lower ascending trend line in the pennant.

Chart courtesy of TrendSpider.com
