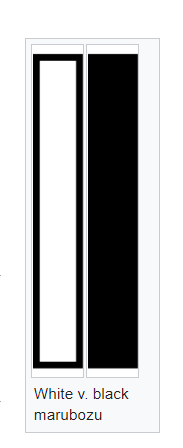
The marubozu is a Japanese candlestick pattern used as a technical indicator of extreme price action inside a specific time period. The marubozu shows visually that an asset has been bought or sold with momentum in one direction with a candle and closed at either its high price or low price of the trading period.
A marubozu consists only of the candle body, there are no upper or lower wicks or shadows outside the top or bottom of the candle.
A white or green marubozu candle has a long bullish body and is created when the open is the low and the close is the high for the full trading period of the candle. The white or green marubozu candlestick pattern shows that buyers were in control of the price of the asset from the opening trade to the closing trade. This is one of the most bullish individual candles in technical analysis and there is a high probability that the next candle on the chart will be bullish.
A black or red marubozu candle has a long bearish body and is created when the open is the high and the close is the low for the full trading period of the candle. A black or red marubozu candlestick pattern shows that sellers were in control of the price of the asset from the opening trade to the closing trade. This is one of the most bearish individual candles in technical analysis and there is a high probability that the next candle on the chart will be bearish.
The marubozu candlestick has a higher probability of success when it happens in confluence with other key technical signals like moving averages, support, resistance, or overbought/oversold readings.
