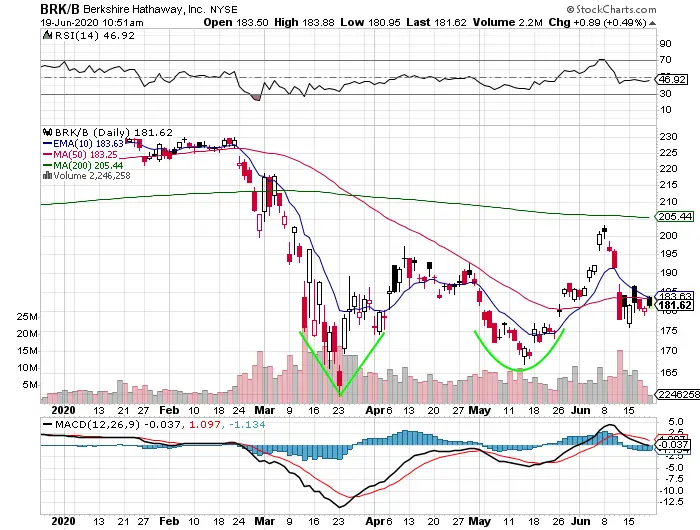
A lesser known chart pattern is the Adam and Eve double bottom. This chart pattern is formed when one sharp V-shaped first bottom low is made on high volume. This is the first ‘Adam’ bottom. Then the price bounces back higher but later goes lower a second time to create a second cup shape as a second bottom that is the ‘Eve’ on decreasing volatility and a tighter price range.
The Eve cup shaped bottom can many times be of a longer duration on lower volume than the Adam sharp bottom. This pattern is a type of double bottom on the chart and price action usually compresses into a tight trading range after both types of bottoms are in then many times will break out to the upside. This pattern is usually followed with a large up swing or trend higher after its second Eve bottom.
A break out above the previous highest price in the Eve cup can be a good signal for a long entry point. The longer term resistance zone is along the top of the highest point between both bottoming patterns and this can be a secondary breakout signal.
Waiting for a reversal and breakout of the eve cup versus buying earlier can diminish the reward with a later entry but can increase the odds of a success versus buying inside the Eve cup near the lows and risking a breakdown of the pattern to new lows in price. A stop loss set at a break of the lows of the Eve cup is an important tool for this pattern because if it fails it can be the signal for a new deeper sell off.
Market sentiment is usually very negative as the second bottom is made and it can be hard to buy psychologically but rewarding when it plays out as an upswing in price. The potential for good short-term profits is high as it has a great risk/reward ratio coming off the second bottom and a trend back higher can be very strong.
Risk must be managed very carefully. Stay open minded that anything can happen. The second bottom must hold as support as a failure to form a cup and a break to new low prices signals a pattern failure.
The Adam and Eve formation can be inverted to identify a double top pattern and signal a looming downtrend in price.

Chart Courtesy of StockCharts.com