 Trading patterns in the financial markets are created by the action of traders and investors buying and selling positions in different time frames.
Here are the different types of patterns that emerge through buyers and sellers behavior.
- Buyers and sellers are always equal with every trade it is the price levels that they meet at that changes.
- Trend lines are vertical or horizontal resistance or support levels created by buyers and sellers inside a trend to create lower lows, higher highs, or price ranges.
- When buyers keep coming in at a price level you will see a key support level in a range.
- When sellers continually exit at a price level you will see a key resistance level in a range.
- Swings in price happen as sellers diminish at higher price levels and buyers come back in at lower price levels.
- Stocks have patterns of accumulation into weakness during uptrends.
- Stocks have patterns of distribution into strength during downtrends.
- Most trends in price are interrupted by trading ranges before the trend continues.
- A breakout of a long term trend trading range or trend line can signal the continuation or reversal of a trend.
- Charts are the visual creation of all traders and investors accumulated past actions of trading patterns.
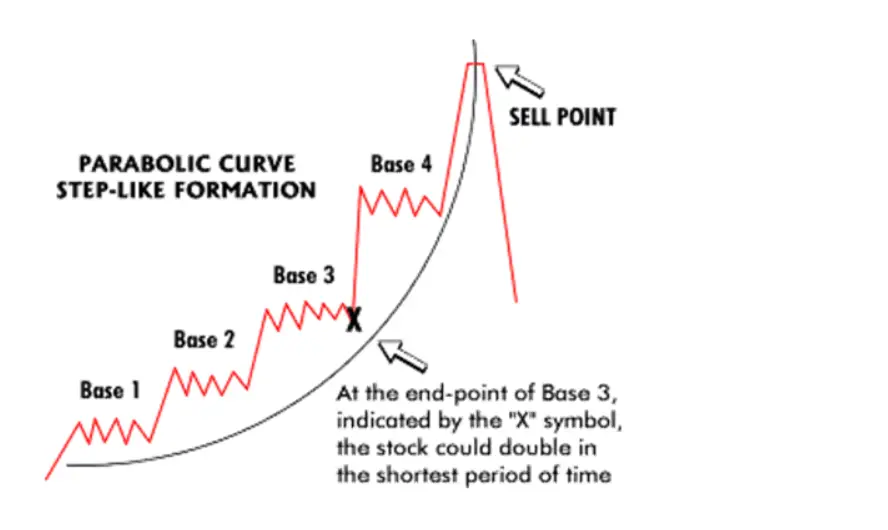
Here is a historical pattern for a growth stock under long term accumulation until it ends and begins to go under a distribution stage.  Chart courtesy of ChartPattern.com
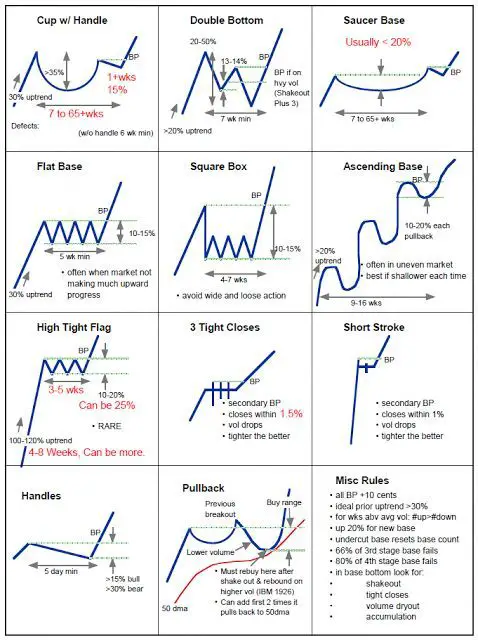
Here is a chart of common bullish, bearish, and reversal trading patterns that play out in markets. The trend line break is their signal. Of course a trader must manage a trade taken with one of these breakouts using the right position sizing, stop loss, trailing stop, and profit target to be profitable.

A chart pattern is not a trading system just like a map is not a journey. It is the management of your trip that determines whether it will be good or bad.
For a full explanation behind the principles of these patterns check out The Ultimate Guide to Chart Patterns.