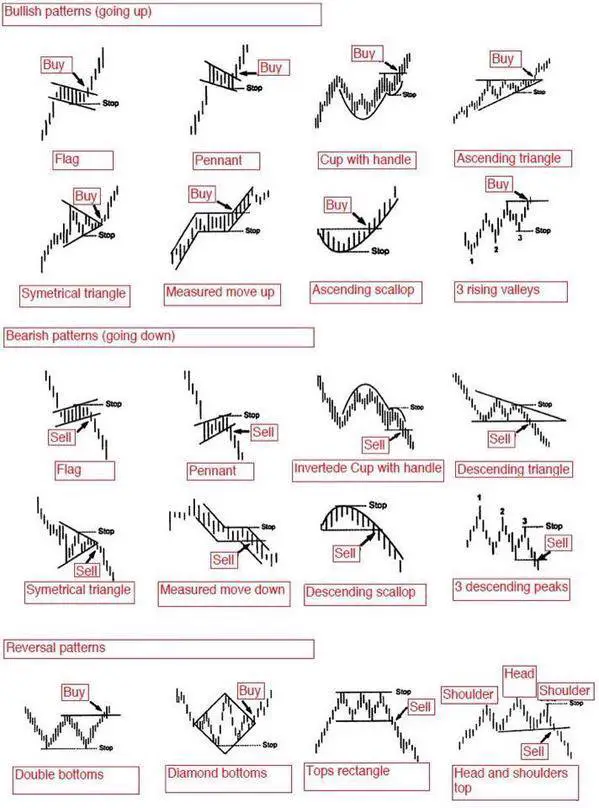
Technical analysis is the art and science of reading price action on a chart. Here is a quick reference guide that can be used as a cheat sheet.
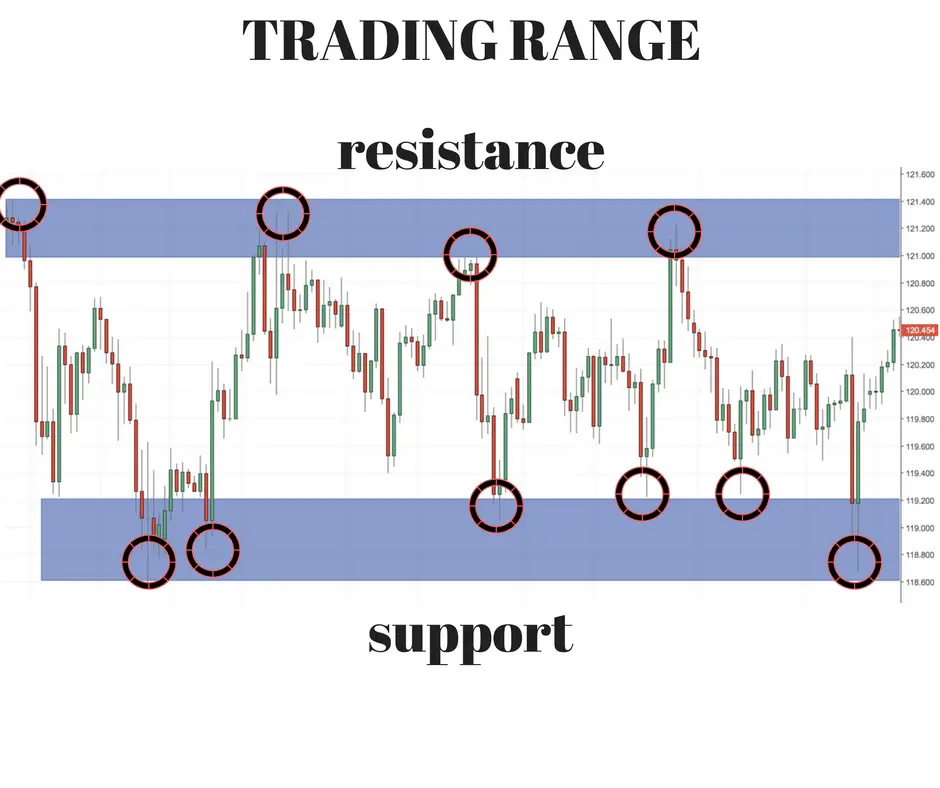
A range bound market can be identified by horizontal upper resistance and horizontal lower support.
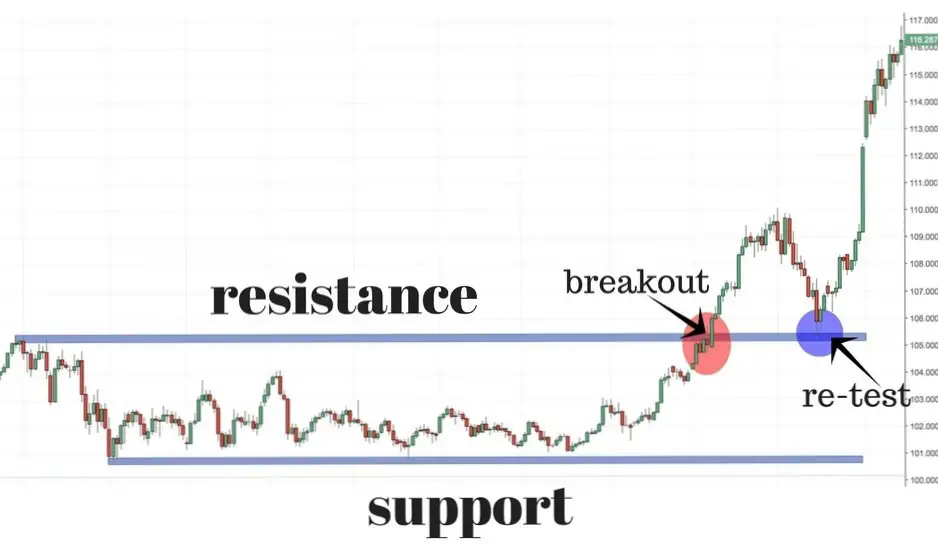
When price breaks out of a trading range it can signal the potential for a new trend in price:
Trend lines are a way to identify a current trend by connecting vertical levels of price resistance and support on a chart. 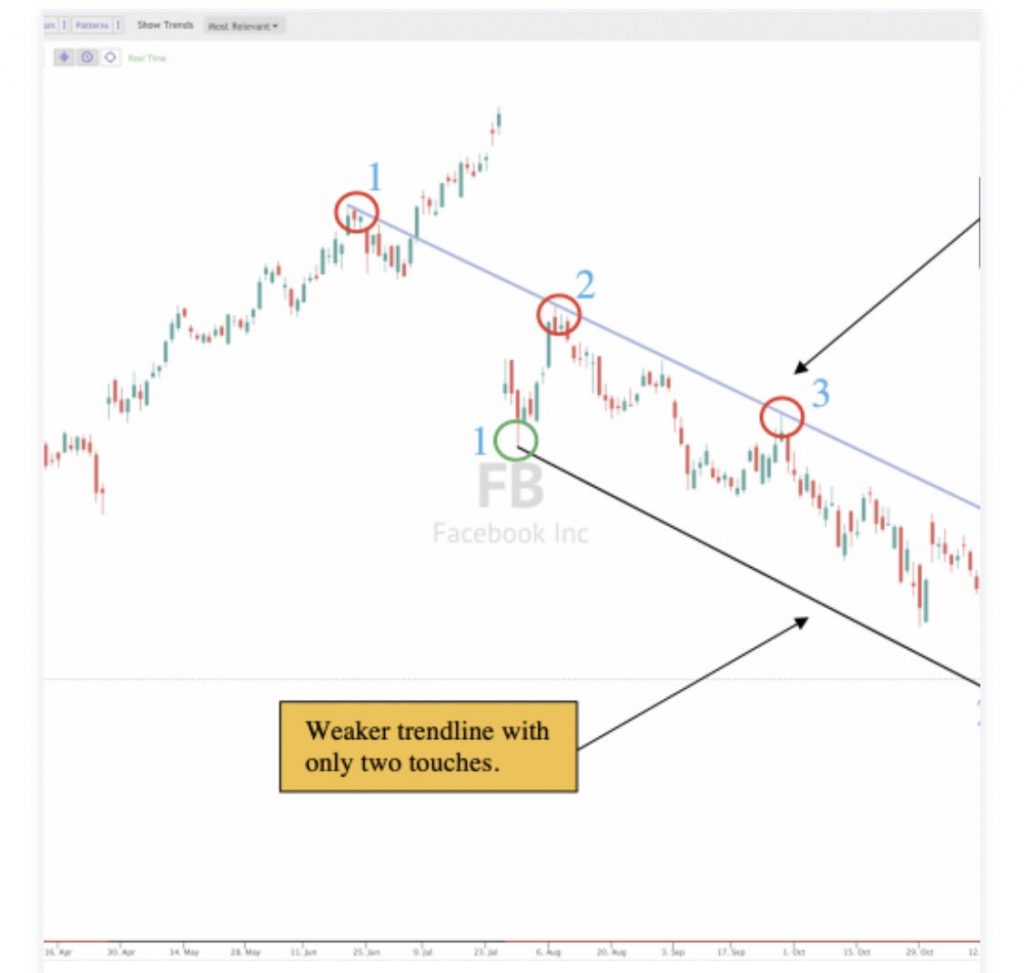
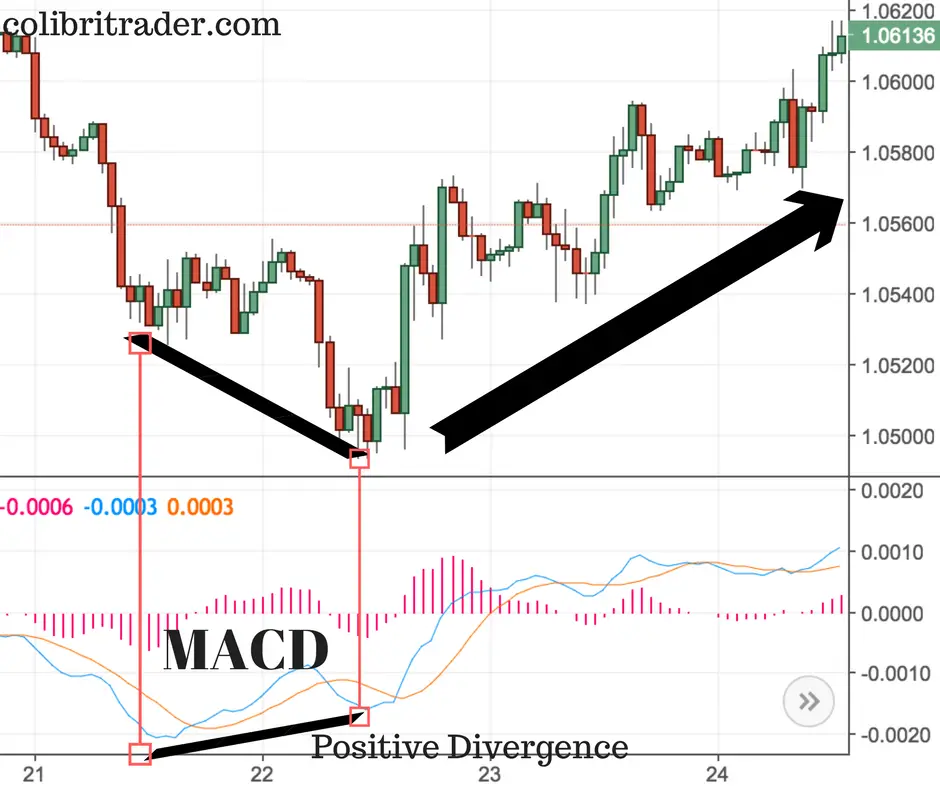
The MACD can signal the beginning of swings and trends on a chart:
RSI can be used to establish the risk/reward ratio on a chart from 30 oversold to 70 overbought:

Moving averages can filter for trends on a chart in the timeframe of the moving average:
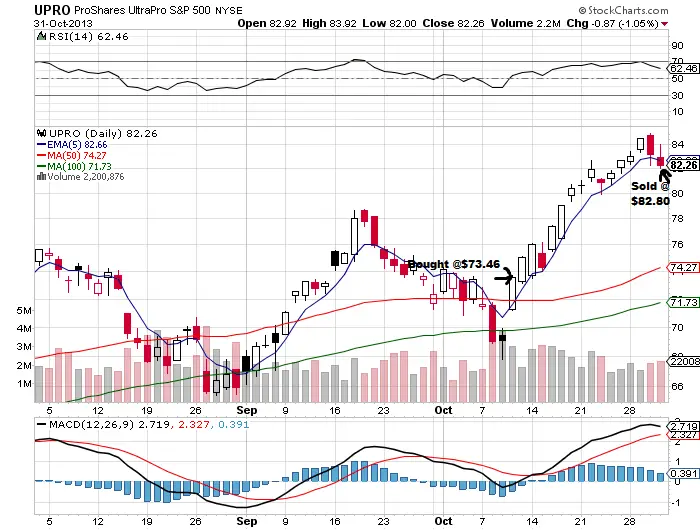
Chart patterns can signal breakouts, reversals, and continuations of current price action.
The best use of technical analysis is for quantifying buy signals, minimizing losses by setting stop losses at key price levels, and using trailing stops to maximize gains.