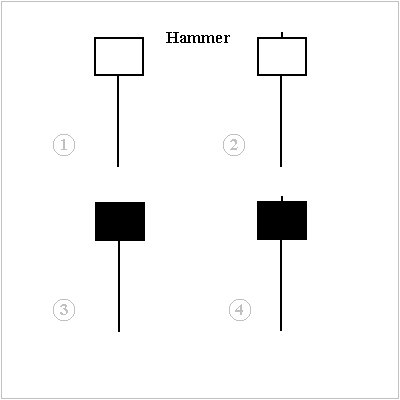
The hammer is the name used for a single candlestick chart pattern that is a bullish reversal signal. Its name comes from the fact that it visually looks like a hammer. As the short body of the candle is on top of a long wick (shadow). Many traders believe for it to be valid the lower wick that creates the handle must be at least twice the size of the upper body. The body must be on the top of the wick with a flat top and very little but preferably no upper wick.
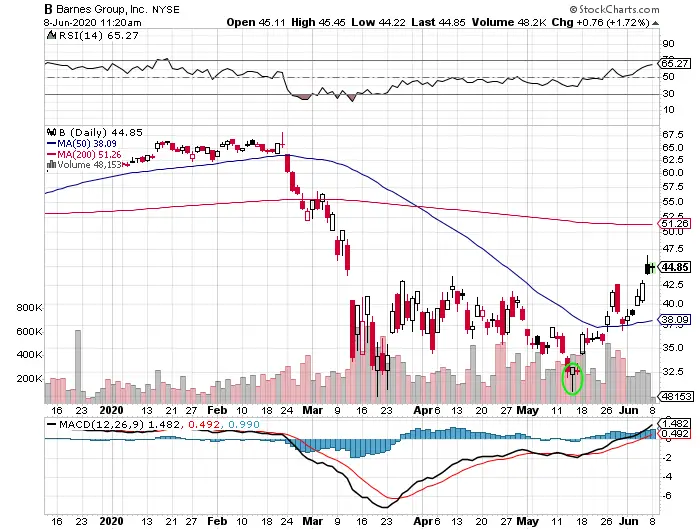
Hammers have a higher probability of being a valid reversal signal when found inside a downtrending chart. The lower wick shows an intraday sell off then reversal to close near the highs of the day showing a rejection of selling at lower prices and buyers taking control of the price eventually during the day. With the opening and closing prices being near each other it can show that the intraday volatility to the downside was rejected and the possible end of lower lows in the downtrend.
After a single hammer candle forms during a downtrend the next day’s candle should open inside the hammer price range or higher to confirm that the reversal did take place. Waiting for one more candle to open or close higher after the hammer formation increases the odds that an entry will be successful.
A longer lower wick can help confirm the price bounce is valid due to the magnitude of the reversal off the lows. Increased volume can also help validate a hammer reversal signal. Hammer candlesticks are best used in correlation with other technical signals like a key previous price support area, and technical oversold bounce, or a moving average for a confluence of indicators to buy.
An inverted hammer candlestick pattern is an inverse signal with the long wick on top and the body at the lows in price for the day and looks like an upside down hammer. An inverted hammer can show the probability of a top being in if made during and uptrend showing a rejection of higher prices with a close near the lows of the day.
 Pic source https://en.wikipedia.org/wiki/Candlestick_pattern

