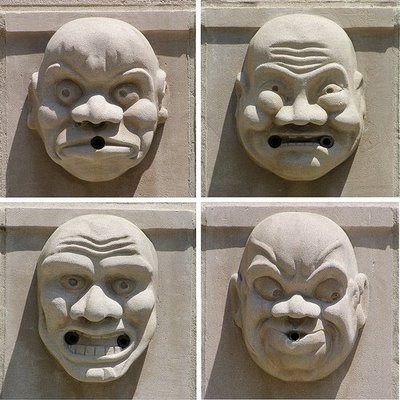
The fear and greed index was created by CNNMoney as an indicator to quantify the degree of emotions that investors are feeling about buying stocks in the current moment.
This index tries to give a measurement of the market sentiment on a scale of fear and greed. Fear generally takes place during downtrends and market bottoms generally take place near maximum fear. Greed generally takes place during uptrends and market tops generally take place near maximum greed.
CNN Money tracks seven different indicators to create the fear and greed index reading which is expressed on a scale from 0 to 100. Where zero is maximum fear and 100 is the maximum of greed.
- Measuring the S&P 500 stock price momentum in relation to its 125-day moving average.
- The number of stocks hitting 52-week highs in price versus how many are hitting 52-week lows in price on the New York Stock Exchange.
- Comparing trading volumes in stocks going up versus the volume of stocks going down to read market breadth.
- The price comparison of put option premiums versus call option premiums. More expensive call options signaling greed and expensive put options signaling fear.
- Quantifying a ‘risk on’ or ‘risk off’ market environment by observing the gap between yields on quality bonds and junk bonds.
- Measures market volatility by the relation of the price of VIX to its 50-day moving average.
- The variance in the current returns on stocks versus treasuries indicates the level of a ‘flight to safety’.
The fear and greed index is used as both to read current market trends and also a contrarian indicator as it reaches near extremes in lows and highs. It can be found here: https://money.cnn.com/data/fear-and-greed/
