This is a guest post by Jake @TrendSpider.
In this blog post, make sure to check out the top 5 TrendSpider charts posted this week on social media as well as the weekend video going over the broad markets and case studies from last week! Happy Memorial Day!
Weekend Video & Case Studies Presented by Jake Wujastyk

View Weekend Video Here
Subscribe to our YouTube Channel For Weekend Updates & Continuous Content
Subscribe To Our Channel Here
Memorial Day Sale
35% OFF ALL PLANS UNTIL MAY 30th!
Top 5 TrendSpider Posts This Week
Bitcoin $BTCUSD has found buyers at the VWAP from June high so far, if that fails the bigger level of interest is 7200-7000 which is where the VWAPs from 2020 high & low are located, a pullback to that level would also set up a potential inv H&S pattern https://t.co/hRLtUwy5ho
— Brian Shannon, CMT (@alphatrends) May 21, 2020
$ROKU daily. Area of interest. Holding so far. See how it closes. Anchored VWAP and daily chart courtesy of @TrendSpider pic.twitter.com/xbYDYSnDZ4
— Ben (@PatternProfits) May 22, 2020
$SPY $SPX Approaching big spot. Price has definitely respected this 40 week / 200 day MA in the past as shown. Also lines up w resistance from summer & early fall of 19. Soon we’ll see if it matters. pic.twitter.com/WZV9Hcooqh
— Gregory Krupinski (@G_krupins) May 20, 2020
Another top watch rest of week will be this $KO breaking the down trend via Daily and Notable High Volume Close in the #RainDrop Candle. Also make note of the #VolumeAccumulation this week. pic.twitter.com/5pe8vFywke
— Stock_Hunter (@Stock_Hunter89) May 21, 2020
$PTON Shaping up nicely. Volume starting to pick up this morning. I have a position. pic.twitter.com/uXEW8l6yP0
— Scott Smith (@livetradepro) May 22, 2020
Broad Market Charts Using TrendSpider
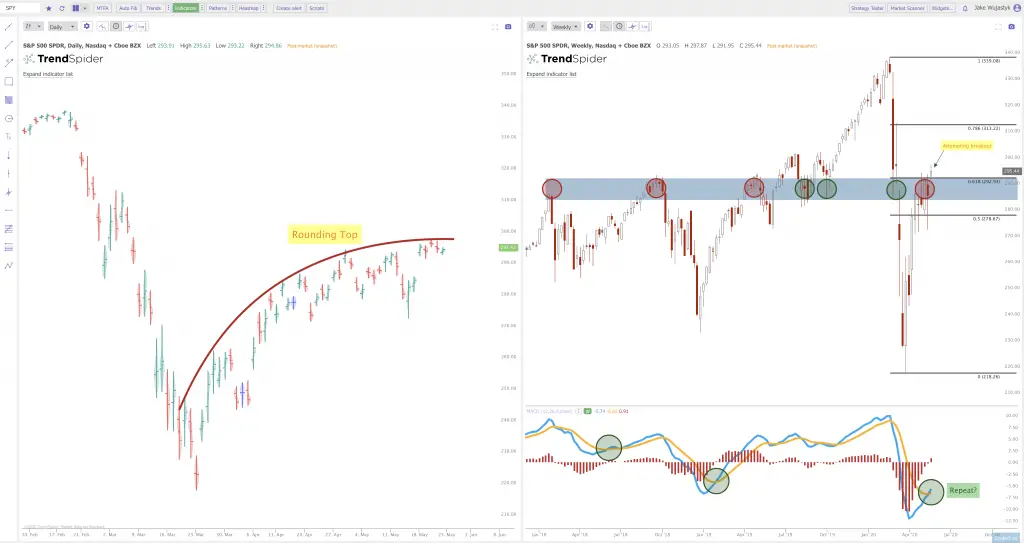
SPY: Daily vs. Weekly Chart
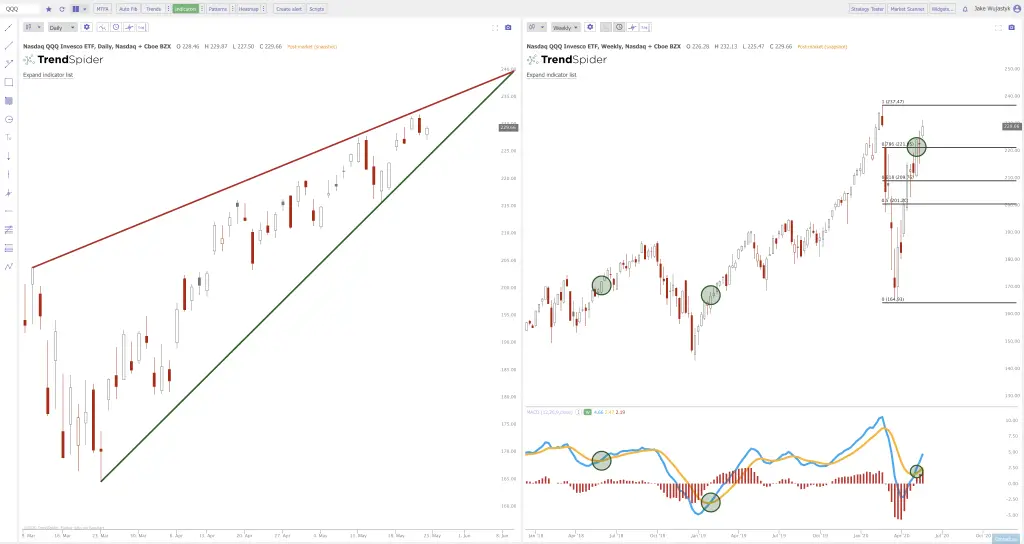
QQQ: Daily vs. Weekly Chart
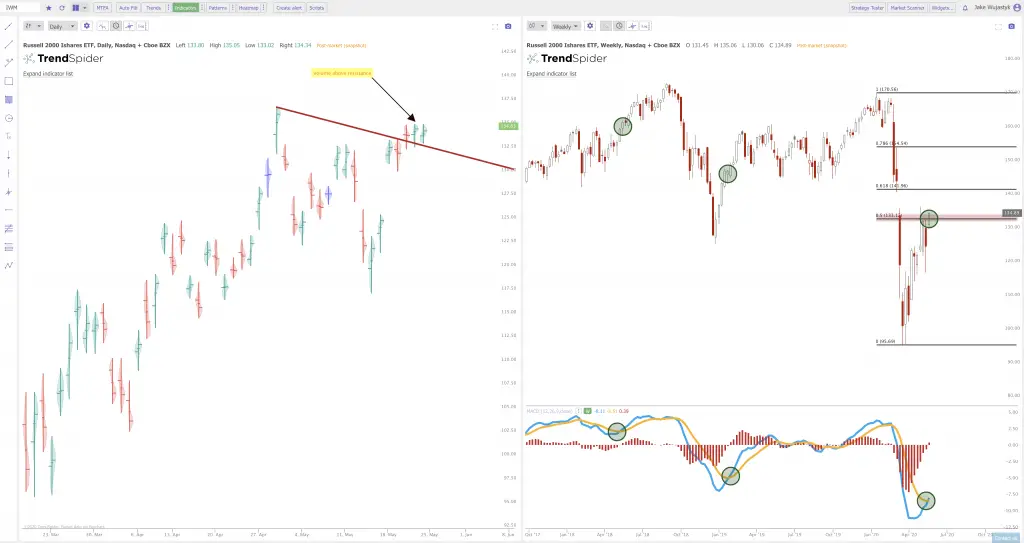
IWM: Daily vs. Weekly Chart

Related Blog Posts
Check out our supplemental blog posts below:
- Alerts – Add alerts to your trendlines and indicators with sensitivity.
- Raindrops – Visualize volume and price action in a completely new way by visualizing volume flow throughout a specific time period.
- Conditional Criteria Alerts – Create complex conditions to be met between a mix of lower indicators and price action.
- Multi-time frame analysis (MTFA) – Overlay your chart a secondary timeframe with on trendlines, indicators, and Fibonacci levels.
- Trendline Preferences – Customize your trendlines to automate a consistent trendline drawing strategy.
- Add Watchlist – Create your own watchlist and quickly move through charts with automatic analysis on each!
- Automatic Candlestick Recognition – Automatically input your favorite candlestick patterns into the system and have TrendSpider find all the ones on your current chart!
Enjoyed this blog? Make sure to click on the links below to follow us on social media for intra-week chart updates:
StockTwits
Facebook
Twitter
LinkedIn
REMEMBER: These are charts that have interesting technical setups based on automated technical indicator analysis included. Charts and analysis provided for educational reasons only. TRENDSPIDER IS A CHART ANALYSIS PLATFORM. IT IS NOT INTENDED TO BE TRADING OR INVESTING ADVICE. ALWAYS DO YOUR OWN DUE DILIGENCE USING MULTIPLE SOURCES OF INFORMATION AND/OR SEEK THE ADVICE OF A LICENSED PROFESSIONAL BEFORE TRADING OR INVESTING. Please read our full risk disclaimer on our website by clicking here.


