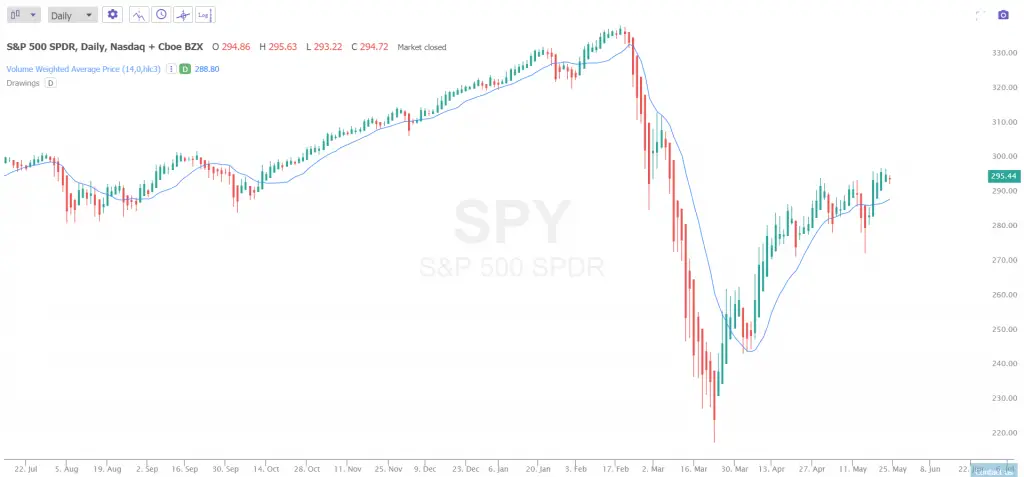
The VWAP (volume-weighted average price) is the ratio of the value of shares traded to total volume that is traded over a specific time period on a chart. It measures and quantifies the average price a stock is traded at for set period of time to create a technical indicator on a chart.
VWAP is a technical indicator used as a benchmark by traders trying to filter out as much volatility, noise, and false signals as possible and stay in a trend until it ends. It is used by many professional traders and money managers.
The primary purpose for using the VWAP as a technical trading filter is to stay in the same direction with the volume flow of the chart. The VWAP is meant to smooth out the ability to capture trends in the market and minimize transaction costs like commission and slippage by staying on one side of a trend with less signals triggered to get in and out of the market.
This indicator can be set to measure the volume-weighted average of prices between any two points on a chart in time. The VWAP is shown as a line equivalent to the time that has passed and average price and volume traded on the chart platform used.
VWAP is often used as a signaling line in mechanical trading system creation and also in faster automatic intraday algo trading.
The VWAP is a very similar technical trend trading tool to moving averages. Just like with traditional moving averages when prices are above the VWAP being used it shows an uptrend or swing higher in price in that time frame and when prices are under the VWAP it can show a down trend or swing lower in the market.
Traders may use the price in relation to the VWAP to signal buy and sell signals. Buying when price breaks above the VWAP and selling when price breaks back below. Trend traders use VWAP trying to capture trends in price for big wins if a trend takes place after an entry using VWAP as a trailing stop to let a winner run or for small losses if after entry price falls back below the VWAP and the trader exits quickly.
Bearish short sellers may also want to sell the market short as price action falls below the VWAP and use that level to stop out for small loss if the VWAP is retaken or let a winner run if price continues to fall further under the VWAP using it as a trailing stop.
The VWAP is a technical indicator that combines both price and volume to create a more concise visualization of the trend of the current market in a designated time frame as represented by a line on the chart.
The VWAP indicator is calculated by adding up all the value of shares traded multiplied by the volume of shares traded and then dividing that amount by the total amount of shares traded.
This is the VWAP formula used to calculate the indicator:


Chart courtesy of TrendSpider.com