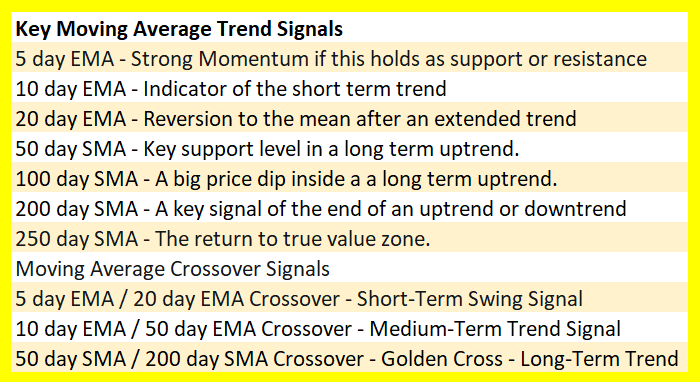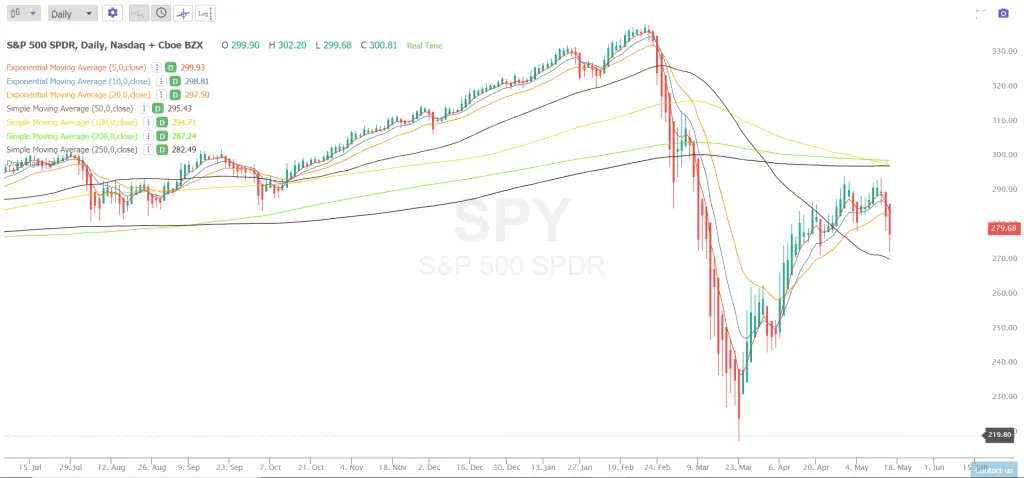
Moving averages are technical trading tools for capturing trends in the stock market.
Moving averages are price action filters that can identify a trend by which side of a moving average price is trading on.
A vertical moving average can show that a chart is in a trend while a horizontal moving average can show that price action is going sideways in a trading range.
The slope of a moving average can visually show the magnitude of a trend direction.
Moving averages can act as key support or resistance levels in both trading ranges and trends.

Here are my four moving average books:
Moving Averages 101: Incredible Signals That Can Make you Money https://amzn.to/3wGrNuz
50 Moving Average Signals That Beat Buy and Hold https://amzn.to/2WwAwyX
Trading Tech Booms & Busts for QQQ http://amzn.to/2tMRDQ0
5 Moving Average Signals That Beat Buy and Hold http://amzn.to/2tMEhmV
Here are my three moving average eCourses:
Moving Averages 101 https://newtraderuniversity.com/p/moving-averages
Backtesting 101 https://newtraderuniversity.com/p/backtesting-101
Moving Average Signals https://newtraderuniversity.com/p/moving-average-signals