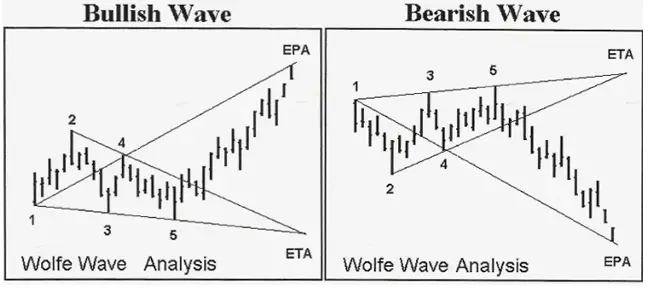
The Wolfe Wave chart pattern is created when price action makes 5 waves showing the key supply and demand areas that create a zone of support and resistance as buyers and sellers fight back and forth until a breakout of the expanding range occurs to a projected price extension.
Wolfe Wave patterns can be created on any timeframe and they are used for two things:
- Project the probability of the path of least resistance for the next price swing.
- Create an entry signal for increasing the odds of being in a position when it moves in one direction.
Wolfe wave patterns can be either bullish or bearish depending on the direction of the breakout of resistance or support.

These chart patterns create breakout signals and are meant to capture trends in price in the direction of the breakout.
Price channels in an uptrend can create a Bearish Wolfe wave and price channels in a downtrend can create a bullish Wolfe Wave and a sideways range happens when price is moving sideways and it can be neutral and break in either direction.
The bullish Wolfe Wave is a type of the falling wedge chart pattern. The bearish Wolfe wave is a type of the rising wedge chart pattern. It is where the breakout of the support or resistance happens that determines the sentiment. The Wolf Wave is similar to an Elliott Wave as it attempts to project the magnitude of the move of a wave.
For a chart pattern to qualify as a Wolfe Wave pattern it must have the following dynamics in price action:
- The 3 and 4 waves must remain inside the channel made by the 1 and 2 waves.
- The 1 and 2 waves are very similar is size to the 3 and 4 waves and are symmetrical.
- Wave 4 is inside the price channel made by the 1 and 2 waves.
- There is consistent time between the creation of all the different price waves,
- Wave 5 is greater than the trendline made by the 1 and 3 waves and is the last key support or resistance area before a reversal in the opposite direction.
- Entries can be made either projecting a reversal from support or resistance at Wave 5 or entries can be made in the direction of the breakout of the trendline created by waves 2 and 4. There is a better probability of success on the 2/4 breakout than the early entry at the first wave 5 level looking for the reversal.
This pattern is not predictive it is simply meant to show a high probability momentum entry signal and to create a good possible swing trade as buyers or sellers push price action to break out of a trading wedge and move to a projected price target.