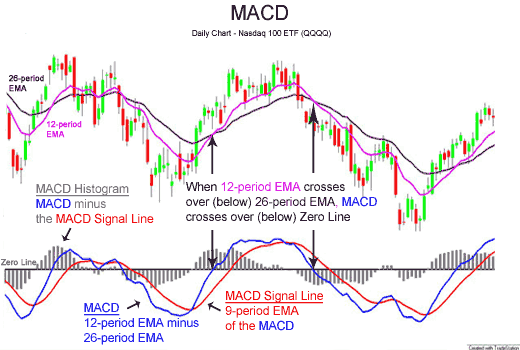
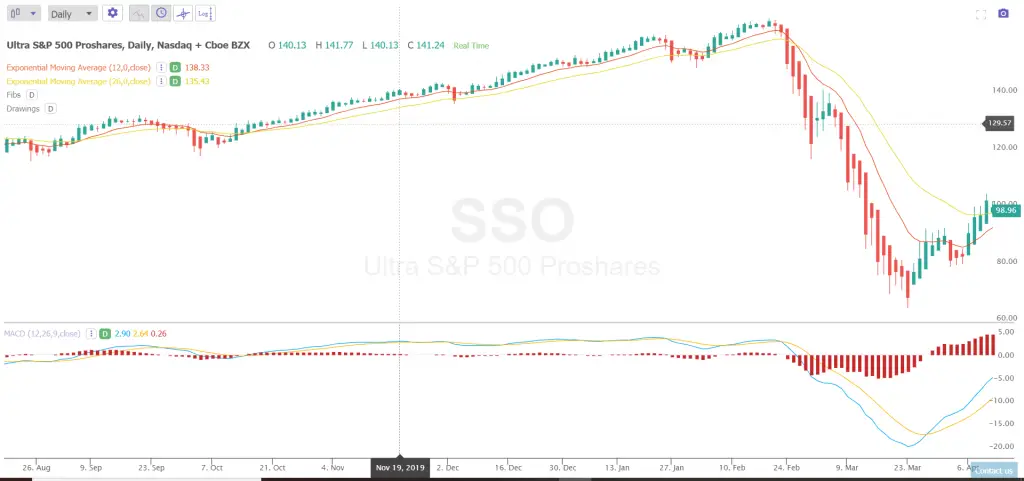
The MACD is an abbreviation for the moving average convergence/divergence technical trading indicator and is used in technical analysis to filter the trends, swings, and momentum of price action. It is designed to reveal changes in price strength, direction, momentum, and duration for the moves of trends and swings.
The MACD is a simple visual momentum indicator. The MACD takes two stand alone moving averages that are used as trend indicators and creates a momentum oscillator by subtracting the longer term moving average from the shorter term moving average. The formula used creates the MACD from the formula and is a dual indicator for both identifying trends and the magnitude of current momentum.
The MACD crossover can show you five things when the signal line crosses back over the slower line after being under it:
- The MACD crossover can show you that a short term swing higher in price could be beginning.
- The MACD crossover can show you that a long term trend higher in price could be beginning.
- The MACD crossover can show you that a previous downtrend that was in place is ending.
- The MACD crossover can show you that a downtrend has ended and the market is now going sideways.
- The MACD crossover can show you that the momentum for a downtrend is over and the market may now start moving both up and down in a trading range.
The inverse is true for the MACD cross under when the signal line crosses under the slower line after being over it.

