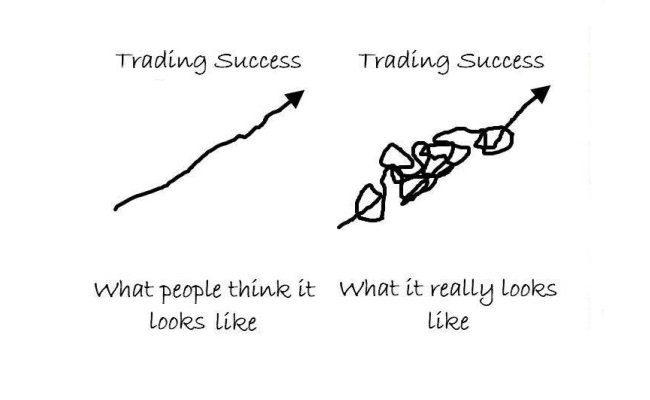
An equity curve is a visual representation of the trend and variation in the value of an investment or trading account shown on a chart over a specified period of time. An equity curve that has an over all uptrend and is near all time highs usually shows that the investing or trading strategy used is profitable over the long term. A negative downtrend in an equity curve will show that an account is either in a drawdown, the market is not currently conducive to the system used, or the investor of trader doesn’t have an edge in the markets if the account stays in a downward slope.
All investors, traders, and trading systems create an equity curve that will have both winning streaks as well as losing periods. An equity curve goes higher as profits are added after winning trades and it goes lower as losing trades create losses and reduce the size of the trading account. The visual chart that is created from the capital fluctuations from winning and losing trades can look like the chart of a stock.
In backtesting trading systems the equity curve data using specific buy and sell signals represents the financial performance of capital in a graph that enables the trader to see how a trading strategy performed in the past over multiple market environments. Looking at equity curves as part of a backtest can be used to see if a specific trading system created big wins and small losses that led to profitability over a long period of time.
An equity curve is focused on measuring and quantifying the performance of a trader or system and does not show personal withdrawals for income.
Position sizing has a huge affect on the level of drawdowns and possible blow ups of an equity curve.
A trader’s equity curve can be a reflection of how good their risk management is in minimizing drawdowns as they occur and reaching new equity highs at regular intervals as the make more money than they lose. One of the reasons most people have trouble with long term investing and trading is that they can’t handle the stress and uncertainty of their equity curve. It can be more difficult emotionally and from a stress management standpoint the larger an account becomes to ride an account up and down when market price action changes affect the win and loss variance due to the monetary size of the losses and drawdowns of a big account.
An equity curve is like a report card for a trader or system that looks at both returns and drawdowns.
“View your trading account as if it were a stock. Strive to maintain a healthy uptrend, with bouts of consolidation, occasional shallow pullbacks, but in a persistent uptrend. Protect the account balance by managing the two sides of risk: risk of loss vs risk of missing a profit.” – Dan Fitzpatrick

Equity curve backtest courtesy of ETFreplay.com
