This is a Guest Post by Miad Kasravi @ZFXtrading of speculatorstrading.com.
Trading with the Flow Part 1 of 3
Volume analysis
Volume spread analysis or VSA. Looks at the relationship between volume traded and size of candlesticks. In it’s basic state the body size of a candle is in proportion with volume traded, in the FOREX market it is tick volume. In other words a large candle will have a large volume bar accompanied.
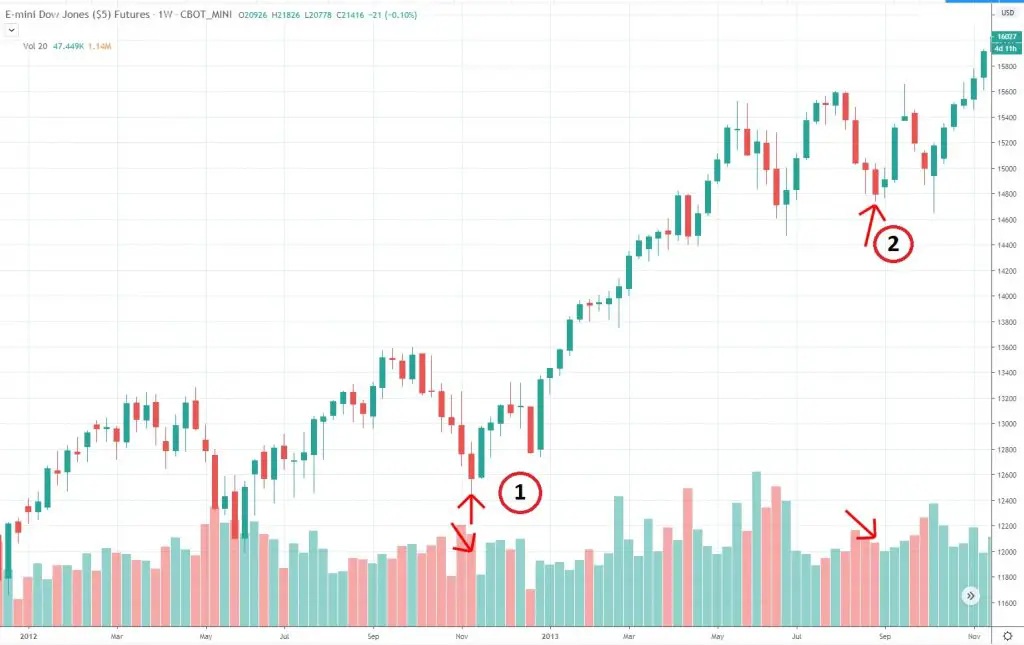
An anomaly develops when there are 3 consecutive falling candles but volume is also falling. That flashes a signal. The signal means there is no selling pressure.

Note at point 1 and 2 in image above. Red falling candles with falling volume created an anomaly. That flags 2 possible scenarios;
- There was no selling pressure. Which means in an up trending market, this is linked to liquidity searches before market resumes rallying
- There were no buyers to meet sellers. Which means in a down trending market, there are no bids and prices rapidly markdown
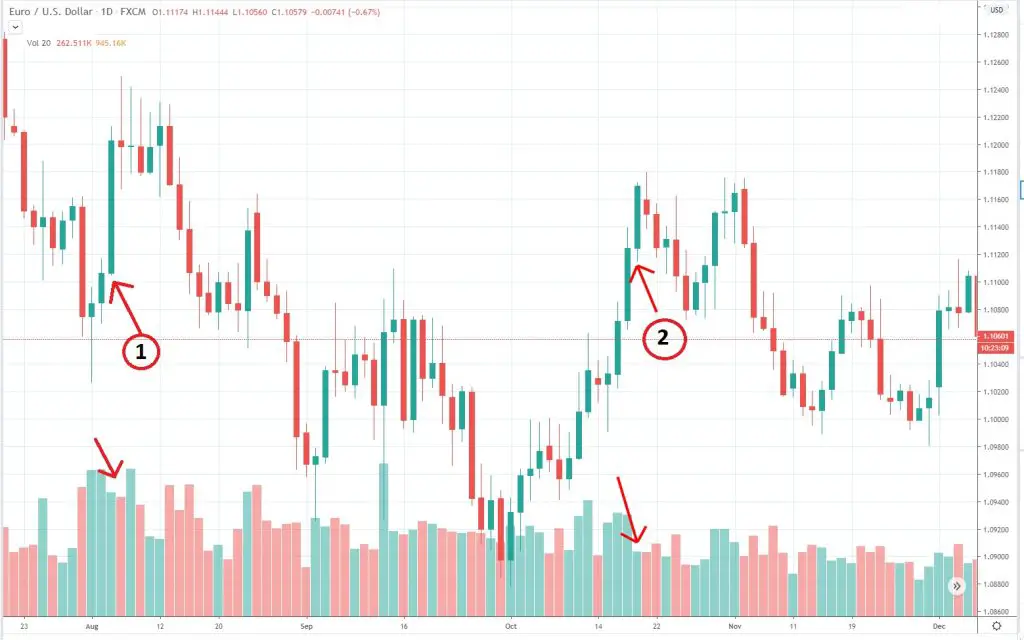
The same anomaly holds true with 3 consecutive up candles on declining volume.
See image below;

These anomalies are very powerful during a pullback in the market, and give excellent opportunity to jump back in on the trend. Further on we explore more intraday examples and the answer to the question burning in your mind ”When do we know it’s an uptrend or downtrend?”
Intraday strategy
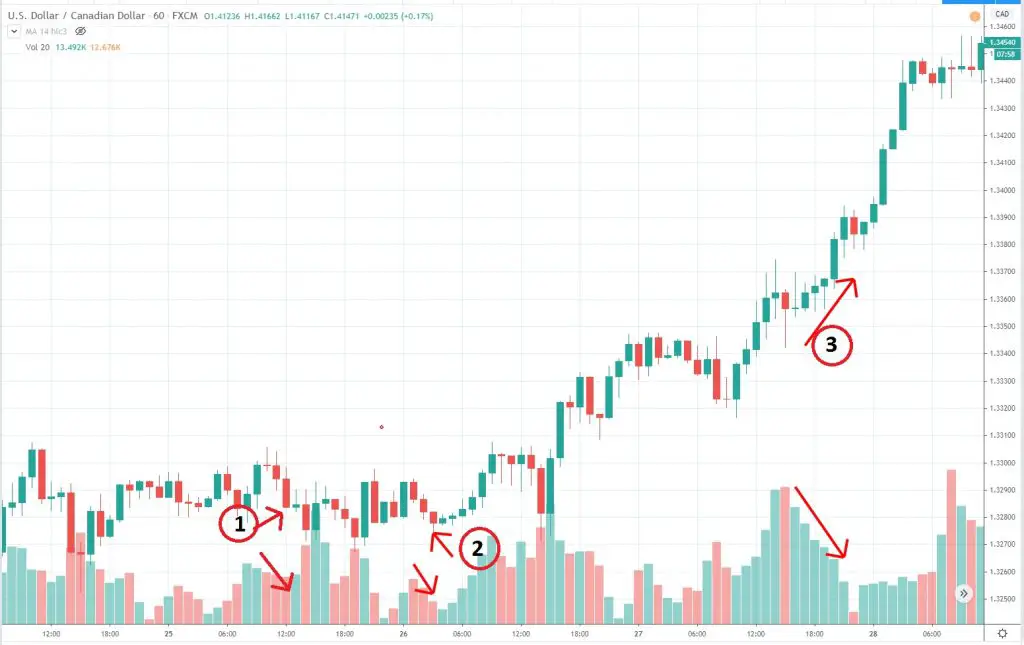
In the image below we have the USDCAD 1 hr chart;

Note at point 1 and 2 down candles increased in size on declining volume. Giving perfect signals to place long bets or buy orders. Following point 3, notably volume declined on up candles. This was due to the fact there were no sellers and prices marked up rapidly as the trend was up. Which is a traders dream, as the long position expanded to the upside. It is worth mentioning sentiment the day before was increasingly in favor of the USD over Canadian dollars. The following day which is what the chart above represents, was a continuation of that sentiment. To understand the direction traders have to vigorously read news, data and political information. Moreover, stay on top of commodity prices that affect currencies, bond markets and major risk assets. But there is an easier way of find flows and direction, albeit less accurate.
Direction and Trend
These points will keep you on the right side of the market more often than not
- In the Forex market major pairs on Friday have a tendency to follow through Thursday’s direction. In other words if Thursday had a bullish tone, Friday has an increased chance to do the same. Barring any major news or disruptive events,on Friday market has a less than 30% chance of changing direction. That gives traders on average an over 70% success rate!
- On longer time frames, seasonality is key. January, April, July, September, and November are trending month.
- Reading news, data and following political events will boost your success rate by over 90%! Information is the biggest weapon in the arsenal
VSA is a leading indicator, offering traders an opening into trending markets. Key being direction and flow. Stay tuned for part 2 where we’ll explore more strategies for trading with the flow.
This post was written by Miad Kasravi and you can follow him on Twitter @ZFXtrading or read more on his website at http://www.speculatorstrading.