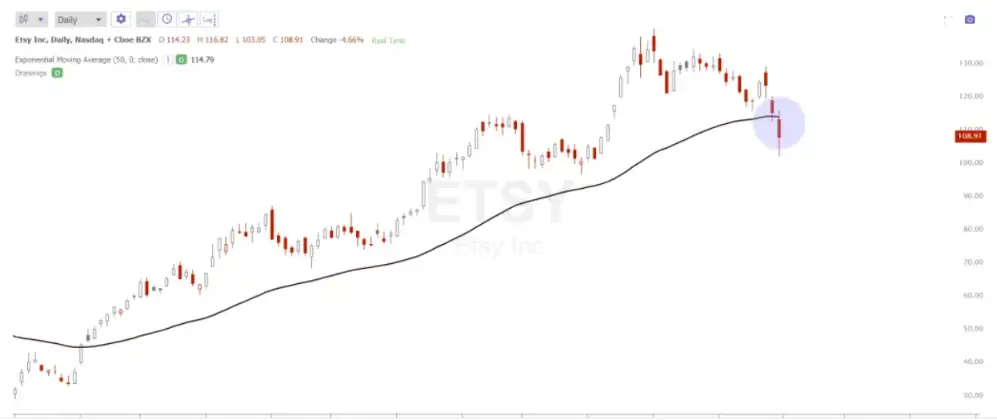
A market trend is the direction that prices are moving in for a specific timeframe. A market can move in an uptrend, a downtrend, and other times just go sideways inside a price range.
Here are simple trend indicators to identify a trend in your trading timeframe.
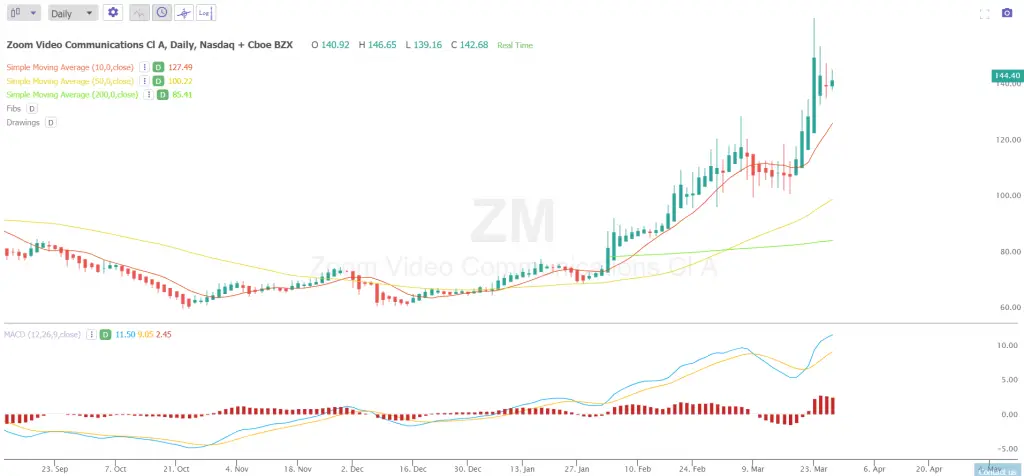
Uptrend indicators:
- Higher highs and higher lows in your timeframe.
- A breakout to all time highs in price.
- A breakout to 52-week highs in price.
- A bullish MACD crossover.
- Price remaining above a moving average in your timeframe.
- A bullish moving average crossover when a shorter term moving average crosses above a longer term moving average.
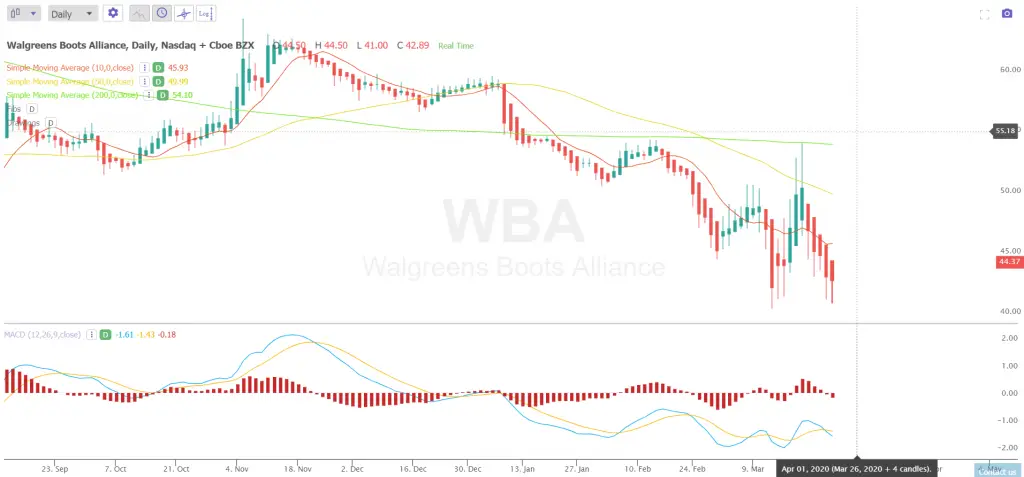
Downtrend indicators:
- Lower highs and lower lows in your timeframe.
- A breakdown to all time lows in price.
- A breakout to 52-week lows in price.
- A bearish MACD cross under.
- Price remaining below a moving average in your timeframe.
- A bearish moving average crossunder when a shorter term moving average crosses under a longer term moving average.
Example of an uptrend in price:

Example of a downtrend in price:
