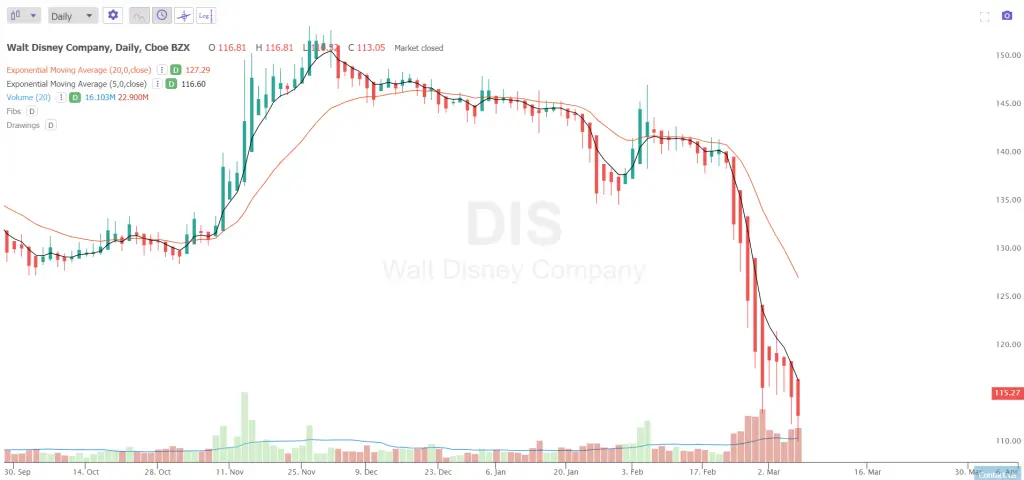
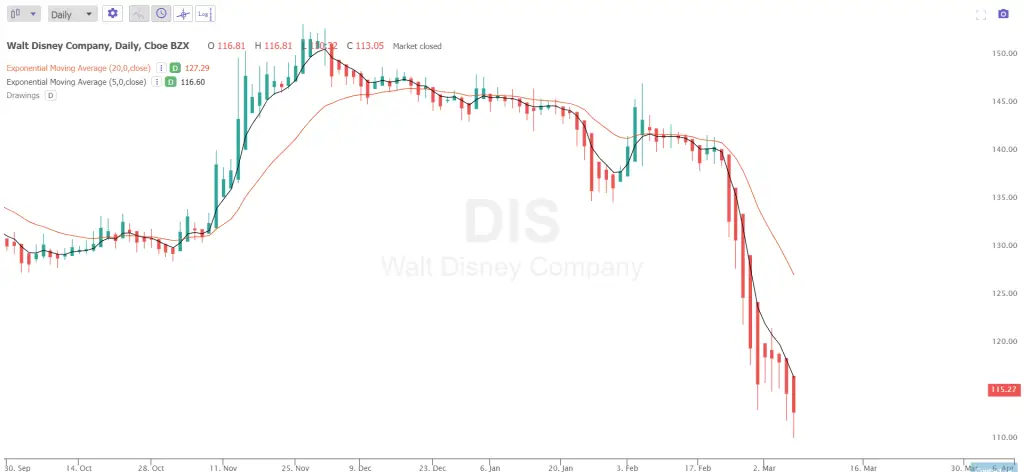
Downtrends are timeframe specific so look for these signals on the timeframe you are trading whether it is intraday, daily, weekly, or monthly.
Here are the ten signals that show a chart is in a downtrend.
- Most downtrends start with a gap down in price, some gaps fill before going lower but it usually is a signal of the start of a downtrend.
- The chart is making lower highs and lower lows in your timeframe.
- Price on the chart is rallying back to key price levels but finding resistance and reversing.
- A moving average is acting as overhead resistance over and over.
- The moving averages are descending on the chart.
- When upper trend lines are connected at the highest prices they are visually declining.
- Most downtrends see increasing volatility as measured by the Average True Range (ATR).
- Price action on the the candles on the chart are closing lower than they are opening.
- Even on most days when price closes higher than the previous day it is still closing lower than the open.
- Most times you will see expanding volume as a downtrend begins and until it ends.

