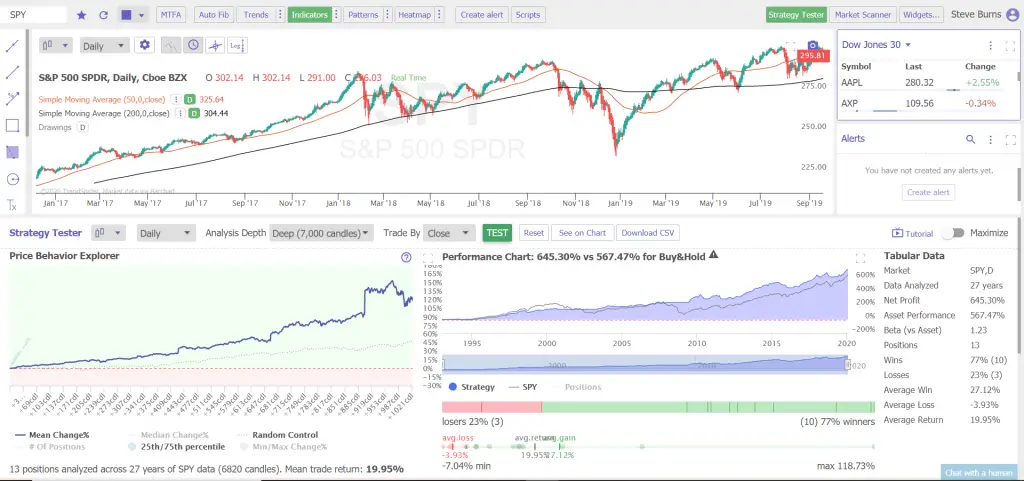
One example of a simple long term trend following system is the ‘Golden Cross’. This is the most popular and famous bullish moving average crossover entry signal along with its inverse ‘Death Cross’ bearish exit or short selling signal.
The Golden Cross happens when the 50 day simple moving average crosses over the 200 day simple moving average crossover and stays above until the end of the day. This signal has you go long when the 50 day simple moving averages closes above the 200 day simple moving average and takes you back to cash when the 50 day SMA closes back under the 200 day SMA signaling the Death Cross.
This strategy is best compared to buy and hold investing using the SPY ETF for the backtest and presents a simple alternate that creates more returns than buy and hold investing by going to cash during extended bear markets and crashes. This is a very long term strategy and closer to trend following or investing than swing trading or day trading.
Historically the cash signal decreases the drawdown in capital dramatically. This moving average strategy stays long in bull markets but not during sustained downtrends. It also filters out much of the noise in price action and does not create many false signals. The weakness is that it is slow to react to quick market crashes.
This is the backtest data in $SPY from 1993-2019 and from $QQQ from 1999-2019.
The $SPY golden crossover signal average return was +19.95% per trade, total return over the full backtest since 1993 was +645.30% versus the buy and hold return of 567.47%. The big out performance started after buy and hold took the substantial draw down in 2008 that the crossover avoided. It also outperformed coming out of the 2002 sell off. Risk management is one of the biggest strengths of this signal.

