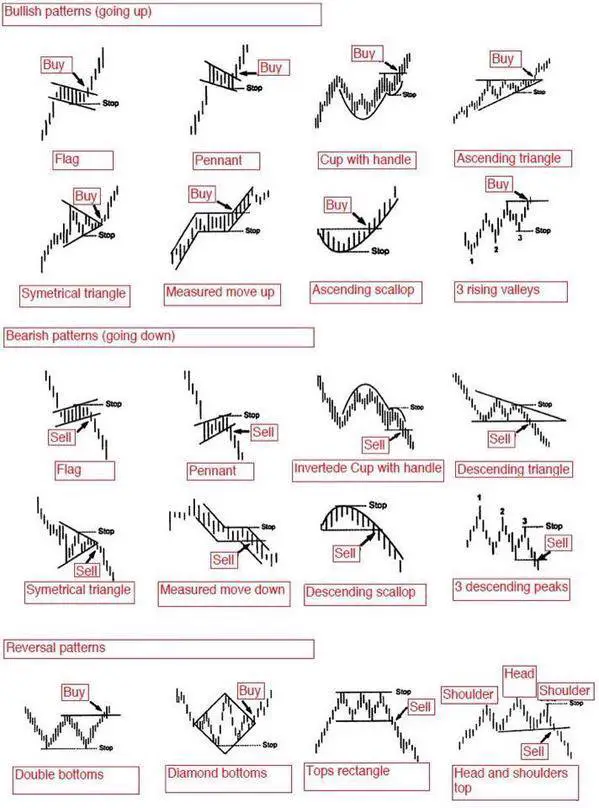
 A chart pattern is simply a visual representation of the prices buyers and sellers bought and sold in the past. There is no magic in a chart pattern they just show you what happened in the past and what has a higher probability of happening in the future.
A chart pattern can show that a stock is in a range with defined resistance and support. A chart could also show an uptrend of higher highs and higher lows are a downtrend of lower highs and lower lows.
The most popular use of chart patterns is for breakout trading signals as the probability increases of a move in a specific direction after a price breakout of a previous support or resistance.
Chart patterns can be bullish, bearish, or show a price reversal depending on the direction of the momentum. They can also be used as risk management tools showing where to set stop losses if a breakout fails or set profit targets for a continuation.
A chart pattern is a visual tool for seeing which direction a market is moving in.
For a full explanation behind the principles of these patterns check out The Ultimate Guide to Chart Patterns.