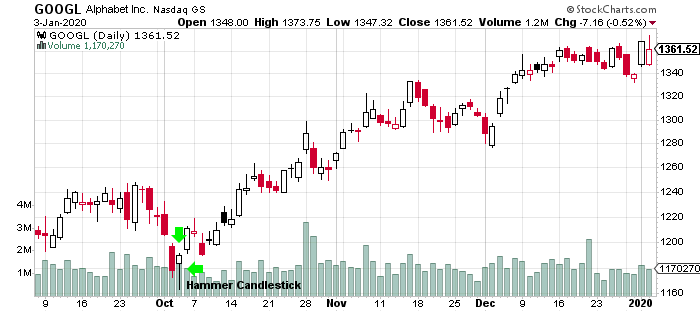
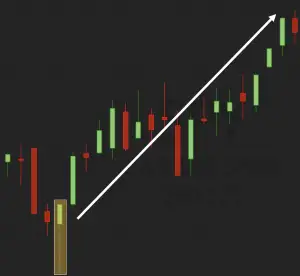
A hammer is a candlestick pattern when a stock opens then moves a lot lower during the day then rallies back near the opening price. This candlestick pattern looks like a hammer with the long lower wick from the lows of the day looking like the handle and the opening and closing price body form what looks like the hammer’s head. The lower wick is usually twice the size of the candle body but can be even bigger.
Fast facts about hammer candlesticks:
- A hammer candle is the first step for a reversal signal during a downtrend.
- Hammer candlesticks have a small body formed from the open and close and a long wick signaling a big intra-day reversal.
- A hammer signals that a chart ran out of sellers at lower prices and buyers stepped in to bid prices back up near the open.
- A move higher with the next candlestick confirms the reversal.
- Most traders buy the next day if their is a confirmation candle not on the hammer candle day.
- The close can be a little lower or higher than the open.
- The lower wick is usually more than two times the range in comparison versus the open and closing price range.
Hammer Candlestick examples:

Chart courtesy of StockCharts.com

Chart courtesy of TrendSpider.com