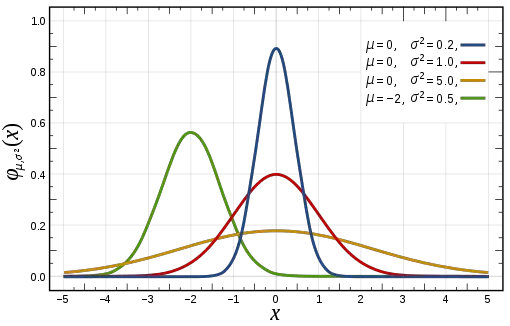
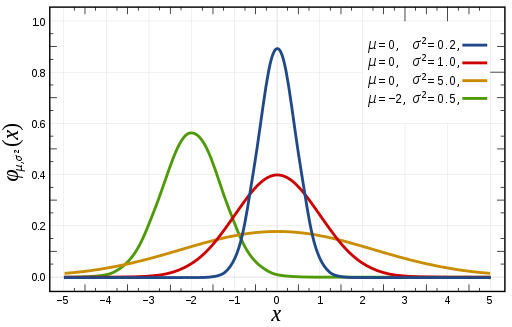
In probability theory a normal distribution is a kind of probability distribution with a set value of random variables.
The normal distribution formula is:
Normal distributions are valuable in statistical analysis and is used a lot in trading to set values on random variables of future distributions that are not known.
Normal distribution states that under market conditions over many average samples of data of random variables with set boundaries of movement the distribution of price data is thought to converge back into a normal distribution of the historical mean as the quantity of the sample size grows.
A normal distribution of prices is a very common type of expected future distribution value that is expected in technical analysis for traders looking for reversion to the mean trades in overbought and oversold markets. A standard normal distribution has two main parameters for measurement of price action: the mean and the standard deviation from a historical average.
Inside a normal distribution of prices this is the probabilities of ranges of price action occurring inside and outside standard deviation parameters from an average.
- 68% of the observations are within +/- one standard deviation of the mean
- 95% are within +/- two standard deviations
- 99.7% are within +- three standard deviations
In trading, normal distribution theory is used to create the range parameters of Bollinger Bands and Keltner Channels. These technical indicators are used to trade reversion to the mean strategies in the markets as they set the odds that a market extended far from a key average of prices will return to the mean.
Inductiveload [Public domain], via Wikimedia Commons


