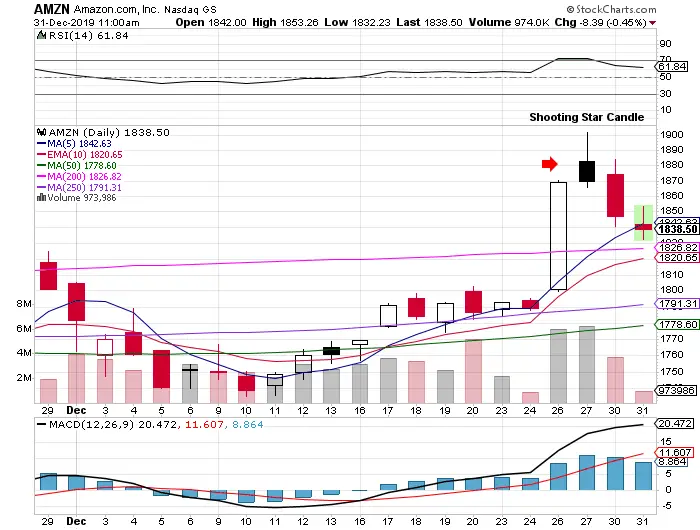
A shooting star candle or pin bar reversal is a bearish candlestick pattern when it appears during an uptrend on a chart. A shooting star tends to have long upper wicks and almost no lower wicks along with a candle body that is usually small. A shooting star usually happens when a stock opens and then goes much higher intra-day but reverses and closes lower near the opening price or lower. The larger the upper wick is relation to the candle body the more bearish it is as it has created new overhead resistance and shows a rejection by buyers at higher prices.
- A shooting star is a bearish signal and could indicate the end of an uptrend and the increased possibility of a downtrend beginning.
- It is bearish because it shows the rejection of higher prices and the beginning of selling pressure.
- If the next candle after the shooting star has a lower high and lower low it increases the probability of the end of the uptrend.
- Price closing back over the high of the day of a shooting star negates the bearish signal.
- Shooting star candles are best used in confluence of other signals like overbought readings, key moving averages, or resistance zones.
